|
The affected version is Zabbix 7.0.14, I can't add this anymore to this issue 
|
|
You mentioned that the system is experiencing high CPU usage. Which Zabbix process is utilizing the CPU?
Is there anything in the log file related to this process? Try increasing the debug level for this process using the runtime command "zabbix_<server/proxy -R log_level_increase=<process name>".
|
|
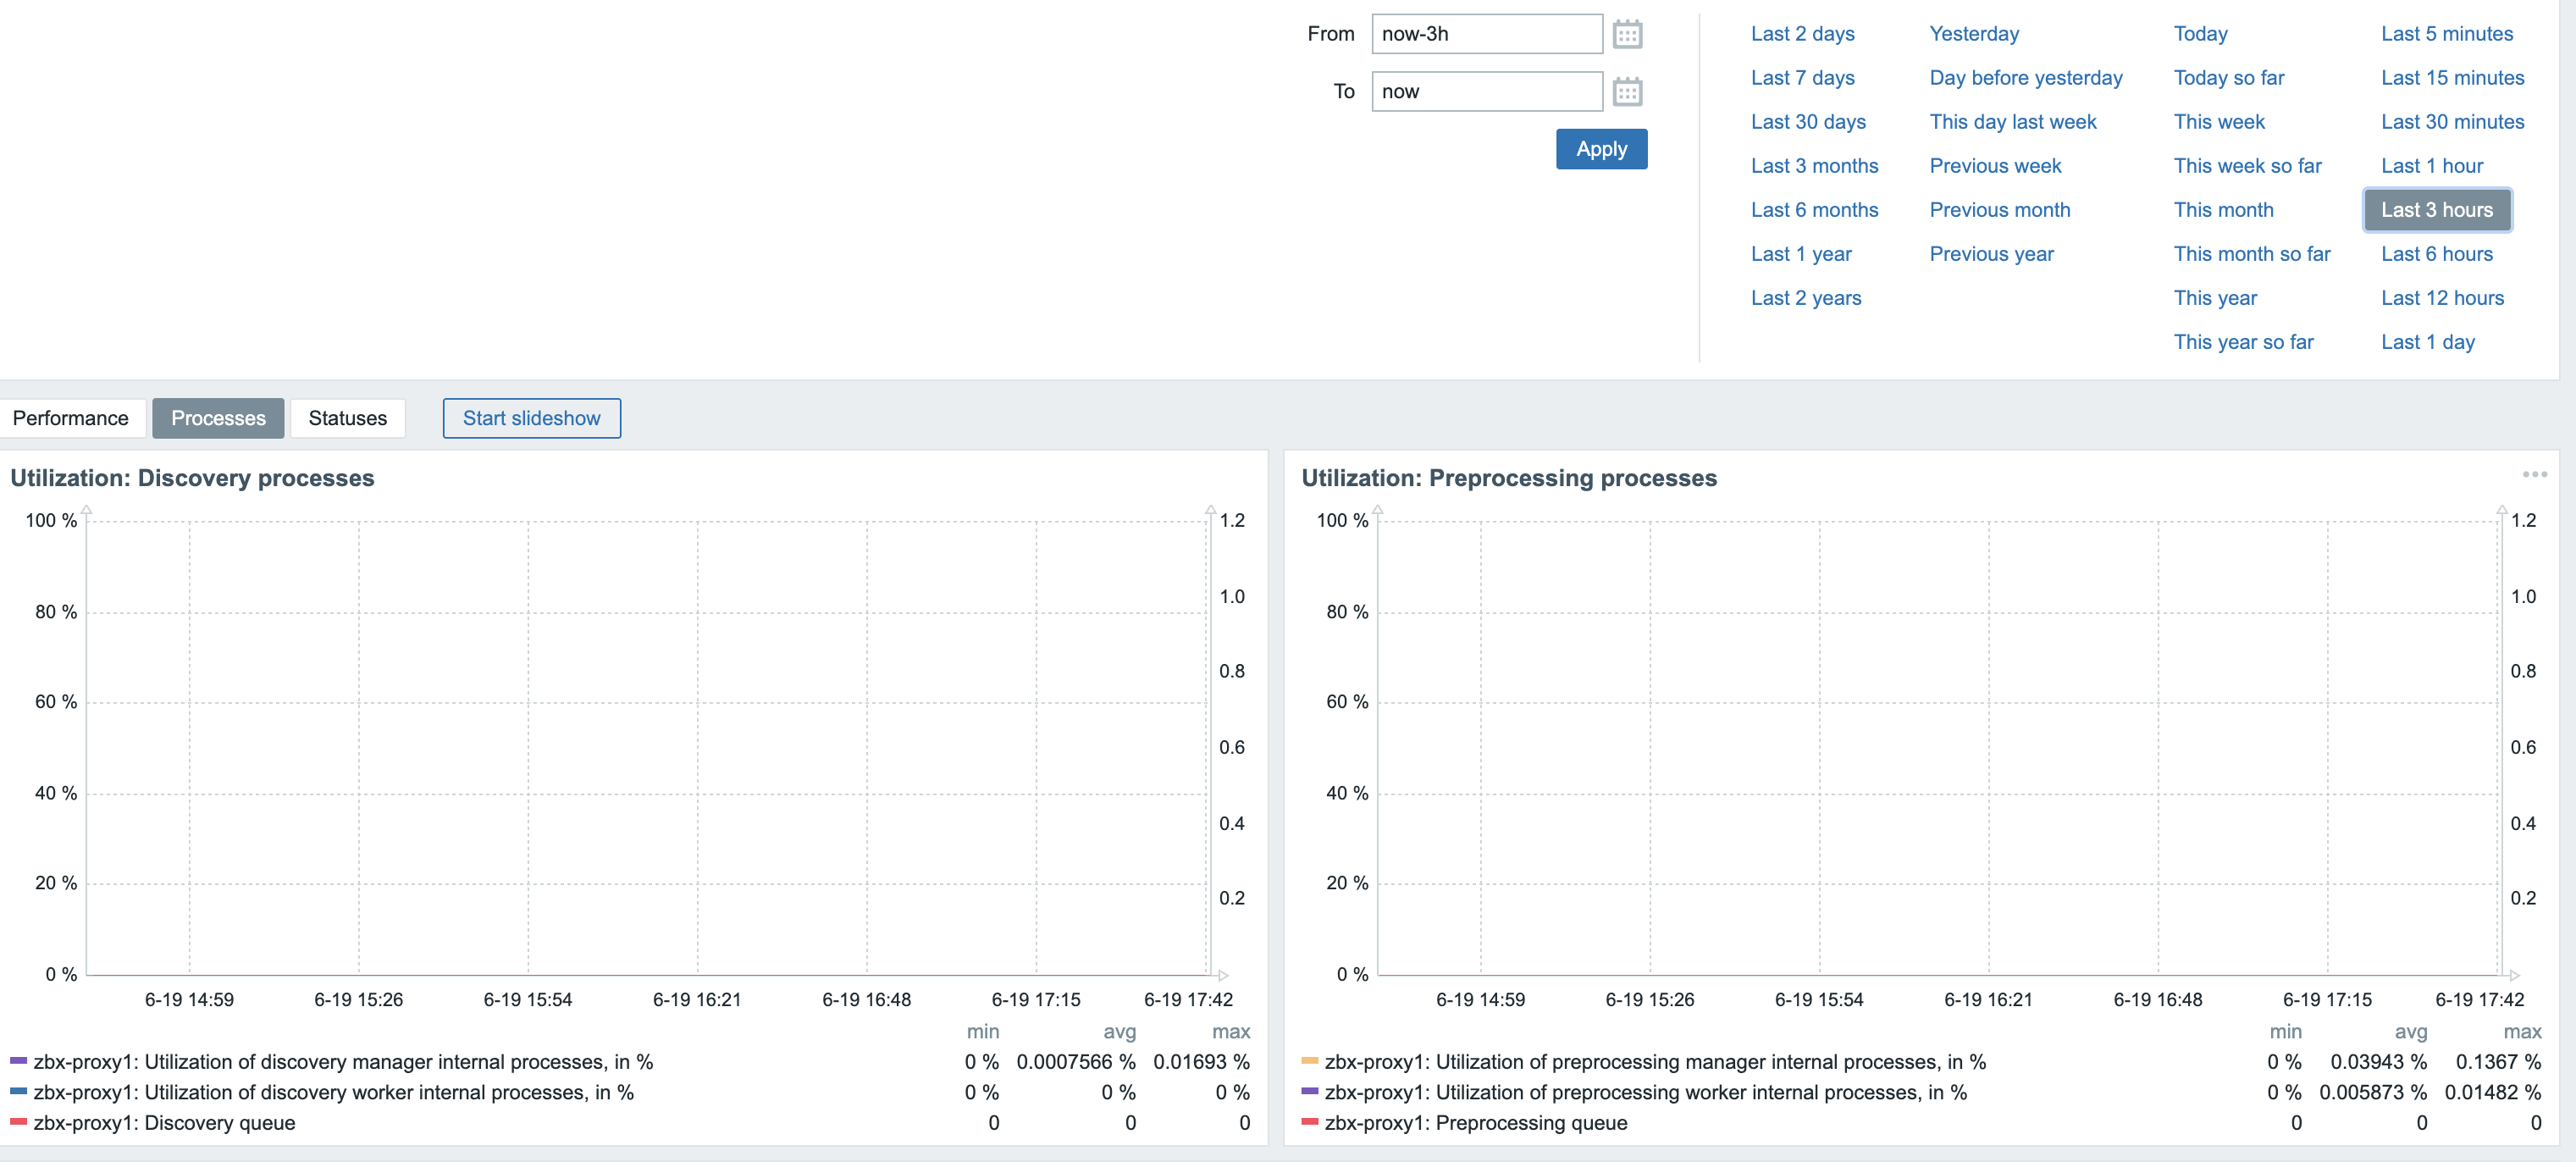
The logfile wasn't saying anything, but it is the preprocessing manager.
I just now increased the debugging for it on the proxy
|
|
zabbix_proxy.log.old.gz
The most recent zabbix_proxy.log is attached. As it produces about 1 GB of logfile per 10 minutes, I have to stop the debug log before it fills up the filesystem.
|
|
I also had high CPU usage issues after upgrading from version 7.0.13 to 7.0.14.
The problematic process is: preprocessing manager.
My Zabbix is on OCI with AlmaLinux 9 (updated) with ARM64 architecture.
My workaround was to add the following to the crontab:
## Problem after version 7.0.14
0 */3 * * * systemctl restart zabbix-server.service >/tmp/restart-zabbix-server.txt 2>&1
|
|
Ok, that's a workaround, but at my installation after 2 minutes the cpu load already gets too high.
I just now downgraded the proxies to 7.0.13 and the CPU load dropped from 100% to 1%... So there is an issue in the preprocessing manager.
I even got it on the Debian host later this night, so it's not specific for Ubuntu.
|
|
raimond.kollman jarbelix , in a moment when "preprocessing manager" is high, increase log level:
zabbix_server -R log_level_increase="preprocessing manager"
zabbix_server -R log_level_increase="preprocessing manager"
Due to extensive logging, this will now result in even higher CPU and disk usage. It should now run on "level 5":
grep "log level" /var/log/zabbix/zabbix_server.log
Keep it running for 3 minutes, then decrease:
zabbix_server -R log_level_decrease="preprocessing manager"
zabbix_server -R log_level_decrease="preprocessing manager"
Ensure it's level 3:
grep "log level" /var/log/zabbix/zabbix_server.log
Extract the most recent lines, compress the log:
tail -9999999 /var/log/zabbix/zabbix_server.log | xz > /tmp/zabbix_server.$(hostname).$(date +%Y%m%d.%H%M).log.xz
Upload log:
https://space.zabbix.com/s/4LDfo4ReGDcxdR5
Su6hHCbFTw
jarbelix on Alma Linux 9, when downgrading:
dnf downgrade zabbix-server-mysql-7.0.13
# or
dnf downgrade zabbix-server-pgsql-7.0.13
Are you confident that big CPU usage goes away?
|
|
zabbix_server.zabbix.20250620.0809.log.xz
zabbix_proxy.zbx-proxy2.20250620.0809.log.xz
Hereby the logfiles, for server and proxy. I had the 7.0.14 proxy saved somewhere so started it a few minutes to deliver the logfile  . I'll now shut it down again and run 7.0.13 for proxy the rest of the time. . I'll now shut it down again and run 7.0.13 for proxy the rest of the time.
|
|
rkollman, thank you! We're working on this issue.
|
|
Added revert patch revert.diff for now.
|
|
Is it possible to test if revert.diff helps with the issue to isolate if it's the root cause and see if it's the reason or something else ?
|
|
Hello, I'm experiencing the same issue since the upgrade to 7.0.14 with the preprocess manager consuming +200% of CPU and having an idle time of 0.004s during 5 sec for a Zabbix server instance monitoring 15 hosts. (Using a LAMP server on a RedHat 7.9 x86_64) After downgrading 7.0.9 everything went to normal. [I have an other instance (7.0.9) monitoring 3000+ hosts with very similar configs, both using MySQL as db and that one works just fine].
Let me know if you require anything from me.
|
|
Reproduced with following host zbx_export_hosts_preprocessing_manager_overload.yaml then send:
./sbin/zabbix_server -R log_level_increase="preprocessing manager"
./bin/zabbix_sender -s "Zabbix server" -z 127.0.0.1  -p 10051 -k trap -o 0; sleep 1; ./bin/zabbix_sender -s "Zabbix server" -z 127.0.0.1  -p 10051 -k trap -o 1
Notice lots of log entries:
0250620:110527.021 End of zbx_ipc_service_recv():2
782466:20250620:110527.021 In zbx_pp_manager_process_finished()
782466:20250620:110527.021 End of zbx_pp_manager_process_finished() values_num:0
782466:20250620:110527.021 In zbx_ipc_service_recv() timeout:0.000
782466:20250620:110527.021 End of zbx_ipc_service_recv():2
782466:20250620:110527.021 In zbx_pp_manager_process_finished()
782466:20250620:110527.021 End of zbx_pp_manager_process_finished() values_num:0
782466:20250620:110527.021 In zbx_ipc_service_recv() timeout:0.000
782466:20250620:110527.021 End of zbx_ipc_service_recv():2
782466:20250620:110527.021 In zbx_pp_manager_process_finished()
782466:20250620:110527.021 End of zbx_pp_manager_process_finished() values_num:0
782466:20250620:110527.021 In zbx_ipc_service_recv() timeout:0.000
782466:20250620:110527.021 End of zbx_ipc_service_recv():2
782466:20250620:110527.021 In zbx_pp_manager_process_finished()
782466:20250620:110527.021 End of zbx_pp_manager_process_finished() values_num:0
782466:20250620:110527.021 In zbx_ipc_service_recv() timeout:0.000
782466:20250620:110527.021 End of zbx_ipc_service_recv():2
782466:20250620:110527.021 In zbx_pp_manager_process_finished()
782466:20250620:110527.021 End of zbx_pp_manager_process_finished() values_num:0
782466:20250620:110527.021 In zbx_ipc_service_recv() timeout:0.000
782466:20250620:110527.021 End of zbx_ipc_service_recv():2
782466:20250620:110527.021 In zbx_pp_manager_process_finished()
782466:20250620:110527.021 End of zbx_pp_manager_process_finished() values_num:0
782466:20250620:110527.021 In zbx_ipc_service_recv() timeout:0.000
782466:20250620:110527.021 End of zbx_ipc_service_recv():2
782466:20250620:110527.021 In zbx_pp_manager_process_finished()
782466:20250620:110527.021 End of zbx_pp_manager_process_finished() values_num:0
782466:20250620:110527.021 In zbx_ipc_service_recv() timeout:0.000
782466:20250620:110527.021 End of zbx_ipc_service_recv():2
782466:20250620:110527.021 In zbx_pp_manager_process_finished()
782466:20250620:110527.021 End of zbx_pp_manager_process_finished() values_num:0
782466:20250620:110527.021 In zbx_ipc_service_recv() timeout:0.000
782466:20250620:110527.021 End of zbx_ipc_service_recv():2
782466:20250620:110527.021 In zbx_pp_manager_process_finished()
|
|
The only workaround is to set StartPreprocessors=1 but it might not be enough to have such low count of workers.
|
|
Released ZBX-26588 in:
- pre-7.0.15 5d01d12deb7
- pre-7.2.9 e8f04b7d4a2
|
|
Thanks to vso, I added the option StartPreprocessors=1 in /etc/zabbix/zabbix_server.conf and it apparently solved it.
PS: I removed my previous crontab workaround 😁
|
|
Documentation updated (preprocessing manager performance issue in Zabbix 7.0.14 and 7.2.8):
|
|
This issue is not resolved. It reappears after updating to version 7.2.9. The PP process starts to consume more and more CPU time until the system load goes beyond normal—far beyond (10+). The only way to fix this is to set StartPreprocessors=1 or downgrade to version 7.2.7.
|
|
It happened again, even after the 7.0.15 update.
Note that in zabbix.conf the StartPreprocessors parameter was commented out.
I have now changed it to StartPreprocessors=1 and restarted zabbix-server.
I will wait and see how it works.
|
|
Could you please be so kind and double check the log so it says 7.0.15
|
|
I'm running 7.2.x this is a fragment from the log file
2545301:20250621:133319.313 Starting Zabbix Server. Zabbix 7.2.9 (revision 7cf2aafa415).
2545301:20250621:135404.993 Zabbix Server stopped. Zabbix 7.2.9 (revision 7cf2aafa415).
|
|
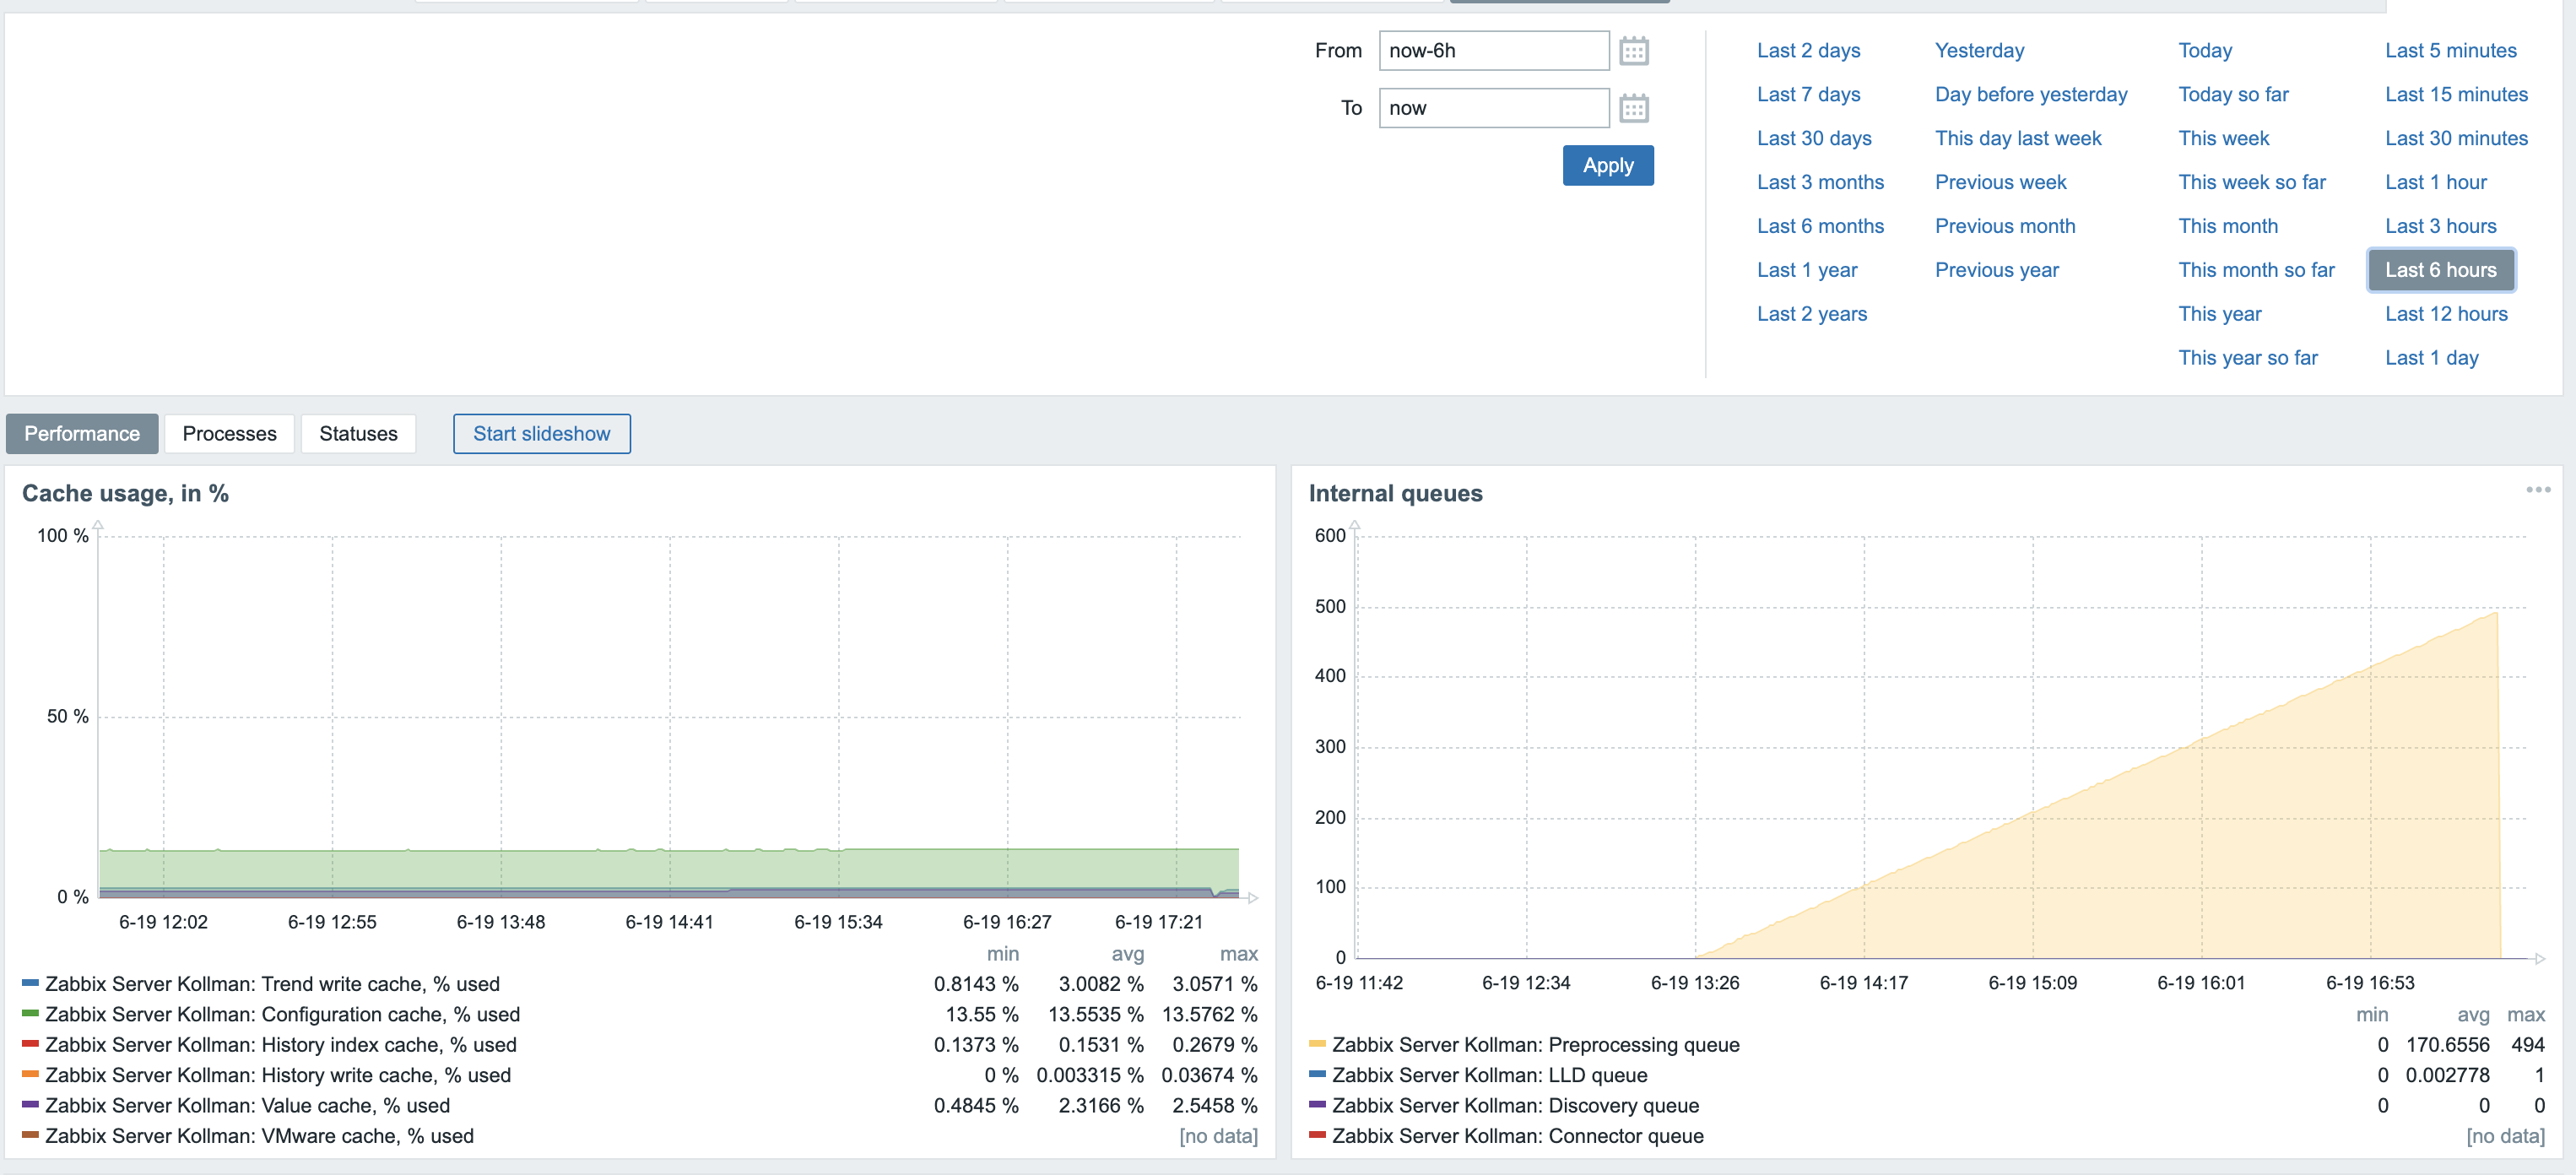
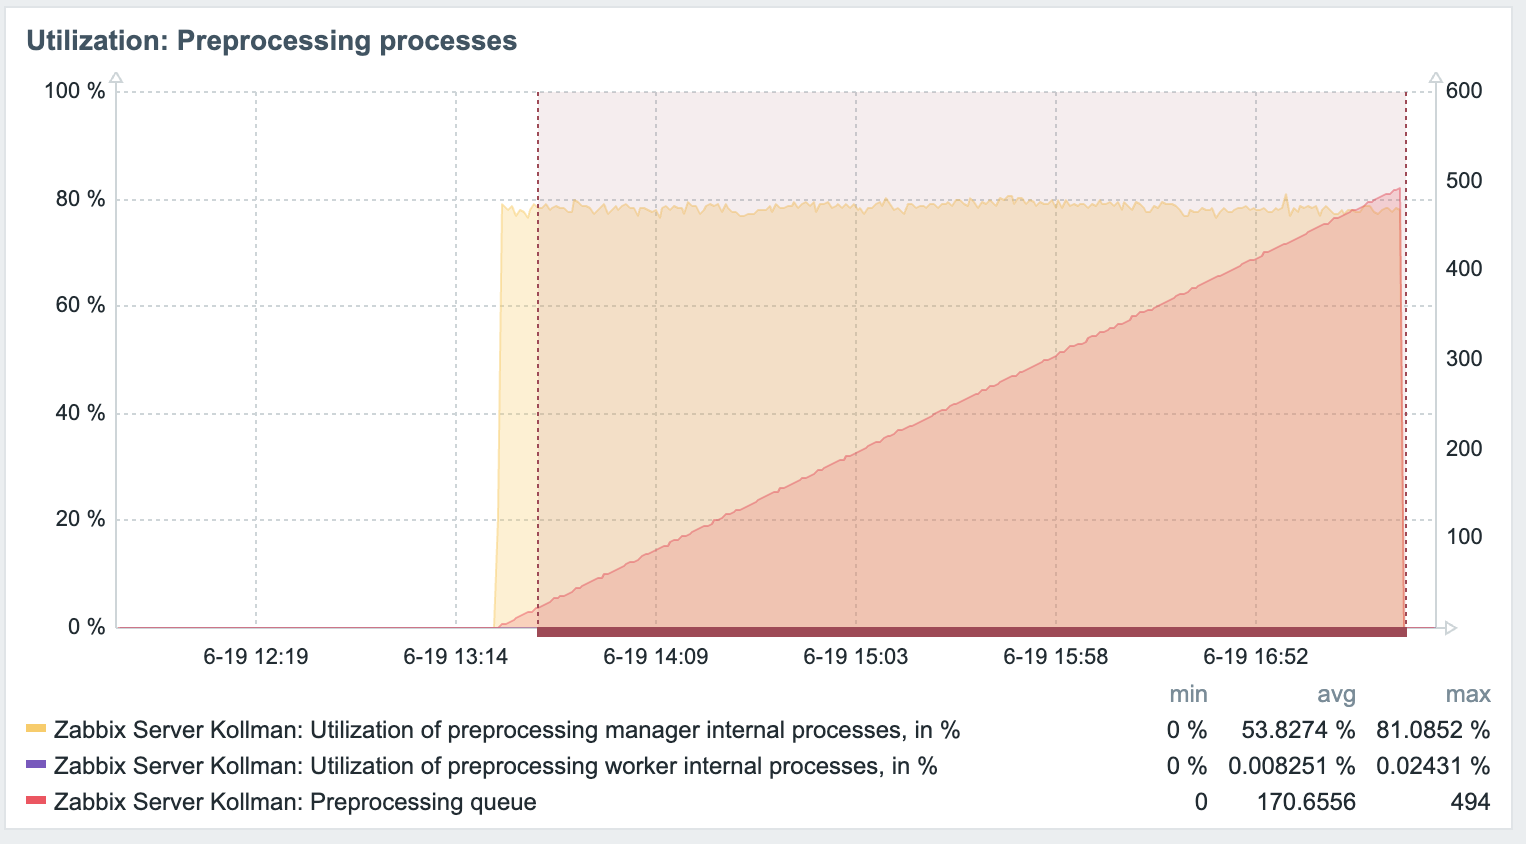
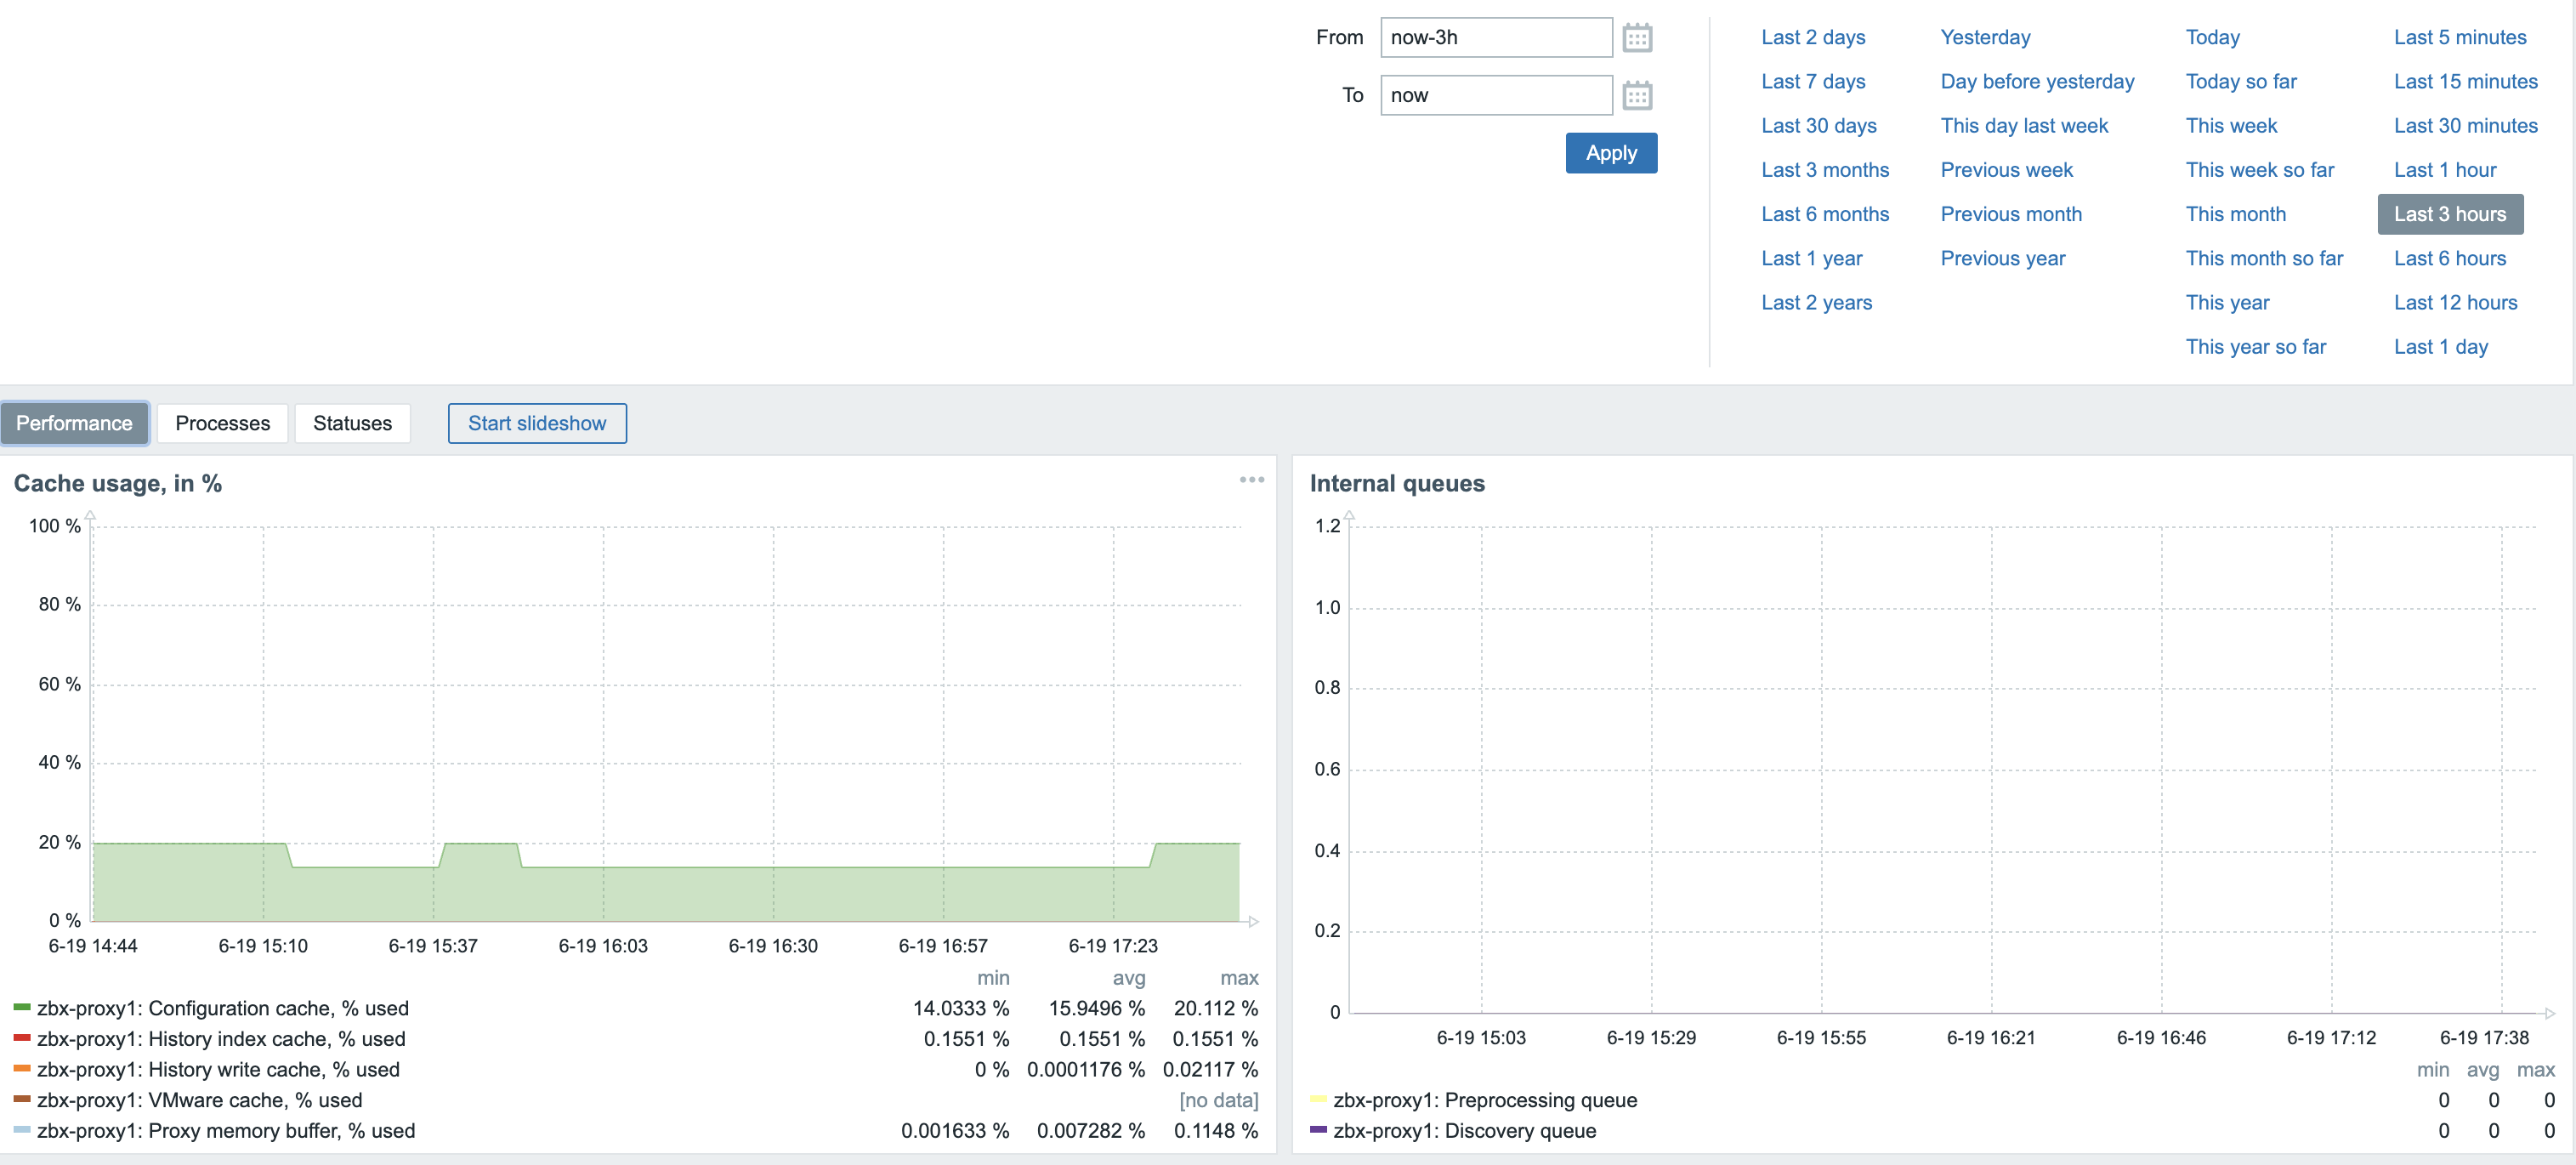
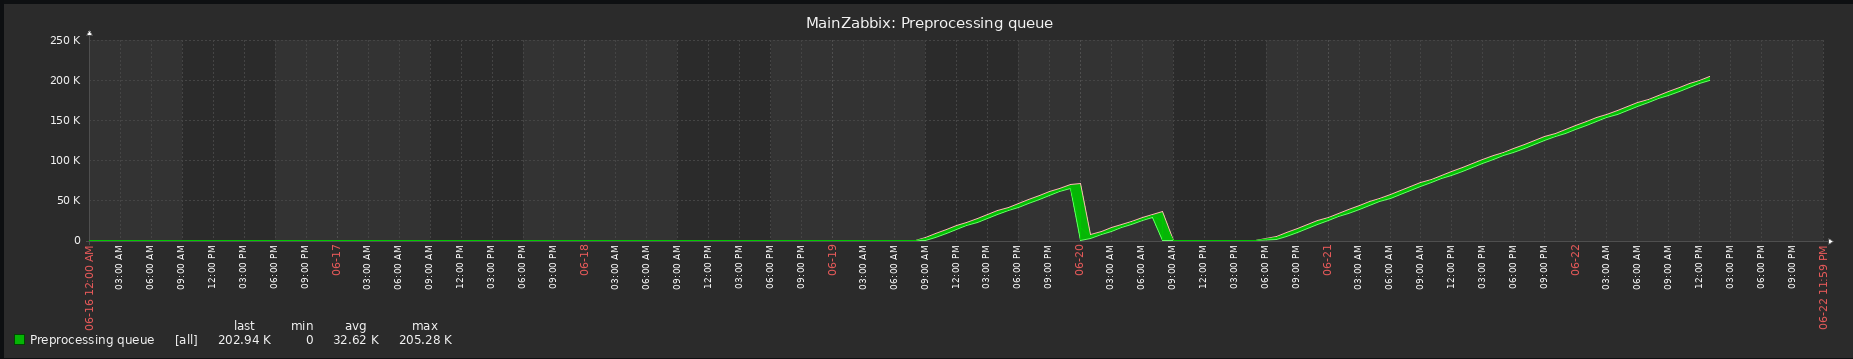
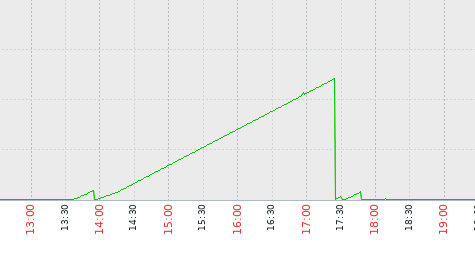
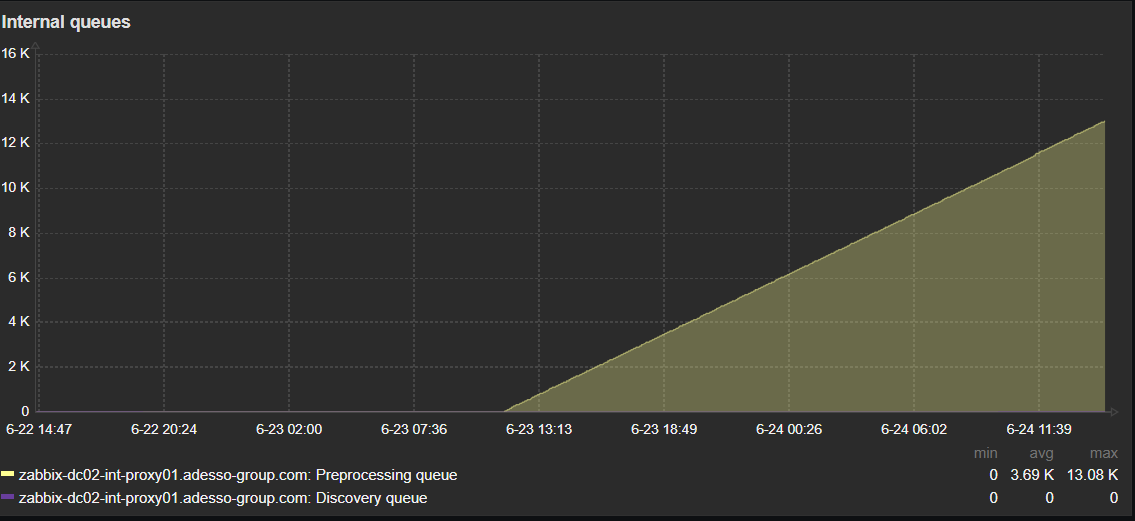
Hi, I'm currently on 7.0.15 and something seems not to be working as before. the 75% precent alert is gone now, but Preprocessing queue is getting higher and higher.
|
|
- 13:36 updated to 7.2.9
- 17:30 attempted to gain control by tuning the {{StartPreprocessors=4 }}parameter. Changed the default value, no good, the same problem reappeared
- 17:47 rolled the Zabbix server (pgsql) back to version 7.2.7. Since then, everything has been working correctly — no PP queue buildup, no unexplained load increase.
|
|
Please check diaginfo=preprocessing if possible to find out which item might be causing issues for queue, unfortunately it’s possible that ZBX-26426 caused more that one issue if there are items with too many values.
|
|
Yesterday I upgraded the Zabbix server from 7.0.14 to 7.0.15 and after a few minutes the high CPU problem was back.
Tried several things (and ofcourse restarted the Zabbix-server.service) and in the end just rebooted the Zabbix server. That fixed the problem..... The logging (also journal-logging of Linux itself) didn't mention problems, but it seems that the reboot gave a real fresh start of the internal queue.
So maybe this can be an advice to users who keep experiencing problems even after upgrading to 7.0.15 (when they first ran 7.0.14 with problems)...
|
|
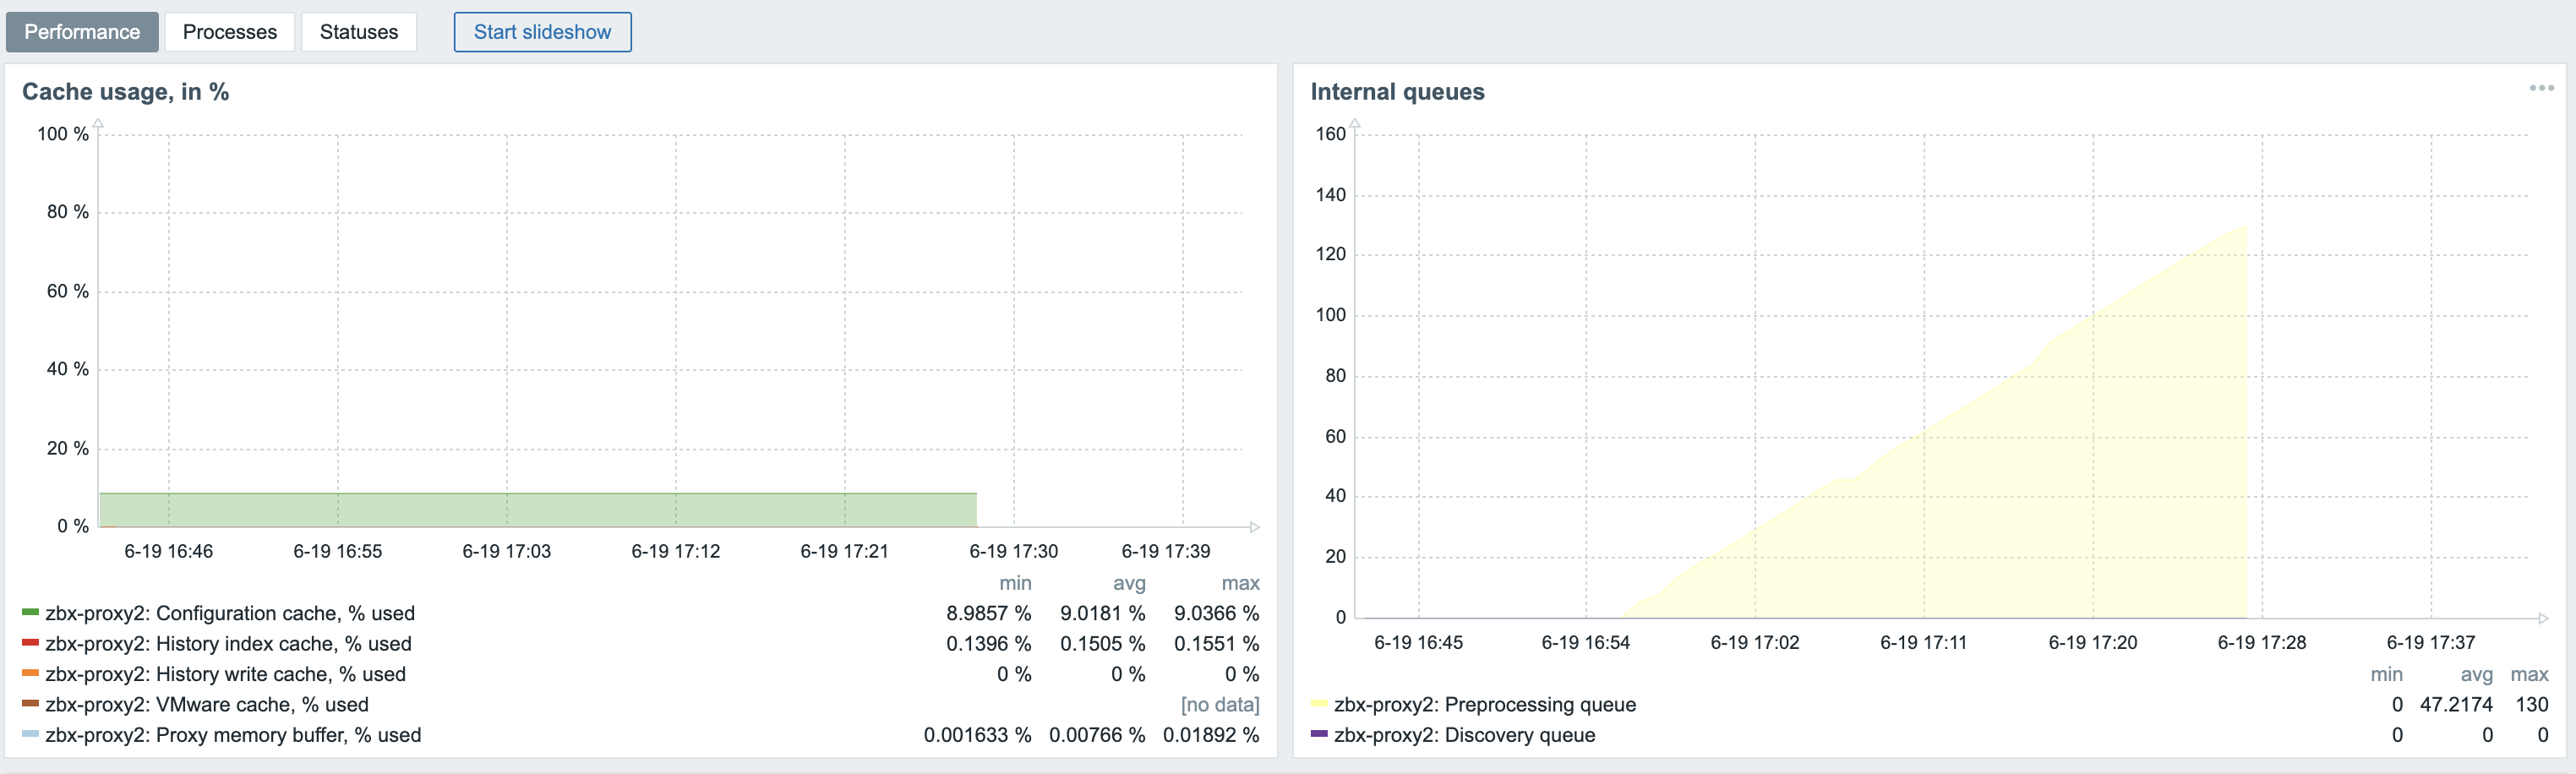
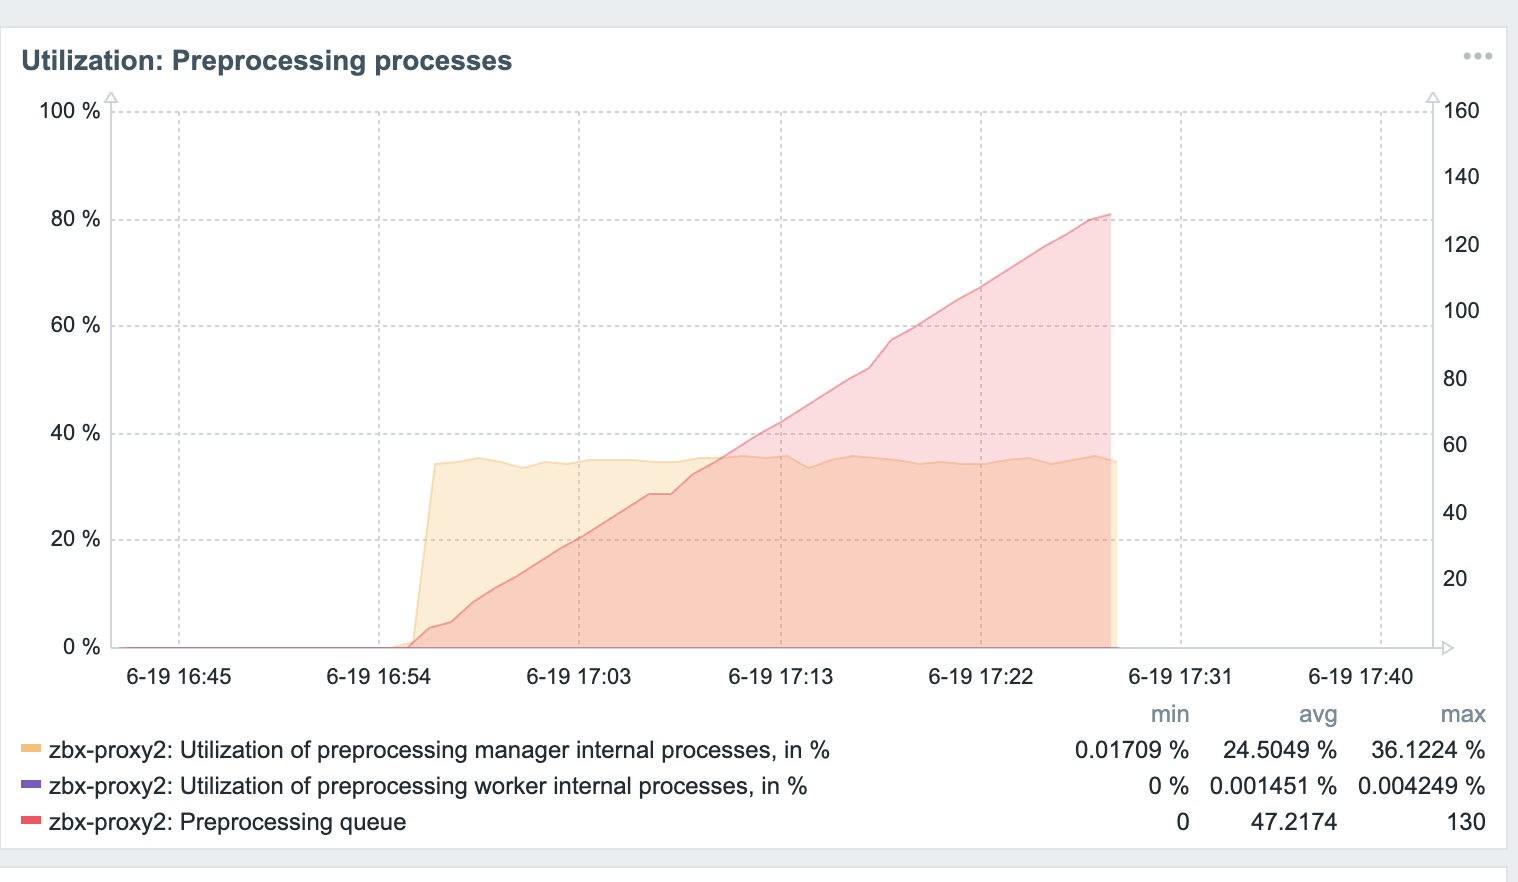
Reboot is not working for me. I am running a dockerized environment, with 8 proxies (7.0.15) . Even if i shutdown the proxy containers and start them again, the high cpu usage of the preproccesing manager is still there and the queue on the proxies is growing.
|
|
I ran the diaginfo=preprocessing on one of my proxies:
root@9a264d58ea96:/var/lib/zabbix# zabbix_proxy -R diaginfo=preprocessing
== preprocessing diagnostic information ==
Cached items:130338 pending tasks:90 finished tasks:0 task sequences:2 queued count:59804 queued size:120722694 direct count:298658 direct size:38582339 time:0.080154
Top.sequences:
itemid:53903 tasks:49
itemid:53772 tasks:45
Top.peak:
itemid:53903 tasks:49
itemid:53904 tasks:48
itemid:53772 tasks:47
itemid:53885 tasks:44
itemid:53748 tasks:4
itemid:53752 tasks:4
itemid:53749 tasks:4
itemid:53744 tasks:4
itemid:53777 tasks:4
itemid:53774 tasks:4
itemid:53778 tasks:4
itemid:53893 tasks:3
itemid:53896 tasks:3
itemid:53892 tasks:3
itemid:53894 tasks:3
itemid:53781 tasks:3
itemid:53771 tasks:3
itemid:53898 tasks:3
itemid:1246171 tasks:2
itemid:830478 tasks:2
itemid:52738 tasks:2
itemid:830740 tasks:2
itemid:832692 tasks:2
itemid:874226 tasks:2
itemid:1221409 tasks:2
Top.values_num:
itemid:53748 values_num:52
itemid:53752 values_num:52
itemid:53749 values_num:52
itemid:53744 values_num:52
itemid:53772 values_num:48
itemid:53903 values_num:48
itemid:53898 values_num:48
itemid:53774 values_num:48
itemid:859854 values_num:25
itemid:1056053 values_num:25
itemid:199574 values_num:25
itemid:76041 values_num:25
itemid:77841 values_num:25
itemid:199524 values_num:25
itemid:805338 values_num:25
itemid:202424 values_num:25
itemid:203874 values_num:25
itemid:206824 values_num:25
itemid:859794 values_num:25
itemid:1056203 values_num:25
itemid:859859 values_num:25
itemid:202774 values_num:25
itemid:198224 values_num:25
itemid:1055803 values_num:25
itemid:200974 values_num:25
Top.values_sz:
itemid:77832 values_sz:2595244
itemid:78382 values_sz:2414806
itemid:200515 values_sz:2394264
itemid:199065 values_sz:2389320
itemid:203965 values_sz:2385204
itemid:200865 values_sz:2233197
itemid:201015 values_sz:2229423
itemid:1056044 values_sz:2227823
itemid:1055794 values_sz:2225010
itemid:65637 values_sz:2223516
itemid:199015 values_sz:2179450
itemid:201715 values_sz:2176941
itemid:48796 values_sz:2069322
itemid:78432 values_sz:2024676
itemid:200965 values_sz:2022966
itemid:202315 values_sz:2016000
itemid:198665 values_sz:2010036
itemid:199515 values_sz:1860576
itemid:206815 values_sz:1853880
itemid:77632 values_sz:1808896
itemid:65537 values_sz:1647564
itemid:202615 values_sz:1620151
itemid:206965 values_sz:1501488
itemid:1056194 values_sz:1496412
itemid:202765 values_sz:1494392
==
root@9a264d58ea96:/var/lib/zabbix#
|
|
I'm sorry to say that 7.0.15 still has the issue. It's taking longer to fill up the CPU, but the problem is still there:
//
zabbix_server -R diaginfo=preprocessing
== preprocessing diagnostic information ==
Cached items:2462 pending tasks:1678 finished tasks:0 task sequences:2 queued count:708752 queued size:778146367 direct count:589062 direct size:60967841 time:0.001715
Top.sequences:
itemid:180998 tasks:841
itemid:181033 tasks:841
Top.peak:
  itemid:181033 tasks:841
  itemid:180998 tasks:841
  itemid:181034 tasks:840
  itemid:180999 tasks:840
itemid:173572 tasks:2
itemid:173253 tasks:2
itemid:186298 tasks:2
itemid:181090 tasks:2
itemid:58839 tasks:2
itemid:180570 tasks:2
itemid:156395 tasks:2
itemid:55041 tasks:2
itemid:59020 tasks:2
itemid:44625 tasks:2
itemid:173309 tasks:2
itemid:181068 tasks:2
itemid:188979 tasks:2
itemid:45195 tasks:2
itemid:134980 tasks:2
itemid:180612 tasks:2
itemid:58819 tasks:2
itemid:181012 tasks:2
itemid:180135 tasks:2
itemid:58809 tasks:2
itemid:58879 tasks:2
Top.values_num:
itemid:188864 values_num:81
itemid:186875 values_num:41
itemid:197119 values_num:41
itemid:180841 values_num:41
itemid:195210 values_num:41
itemid:44362 values_num:41
itemid:173253 values_num:41
itemid:186298 values_num:41
itemid:181090 values_num:41
itemid:58839 values_num:41
itemid:180570 values_num:41
itemid:181276 values_num:41
itemid:39823 values_num:41
itemid:145686 values_num:41
itemid:10076 values_num:41
itemid:180069 values_num:41
itemid:156293 values_num:41
itemid:156395 values_num:41
itemid:180175 values_num:41
itemid:59020 values_num:41
itemid:10075 values_num:41
itemid:181033 values_num:41
itemid:196838 values_num:41
itemid:180387 values_num:41
itemid:173309 values_num:41
Top.values_sz:
itemid:173519 values_sz:1040321
itemid:45199 values_sz:862074
itemid:47339 values_sz:862006
itemid:45211 values_sz:858061
itemid:47327 values_sz:837211
itemid:58262 values_sz:757501
itemid:181090 values_sz:363260
itemid:181105 values_sz:363137
itemid:181078 values_sz:362809
itemid:181099 values_sz:362522
itemid:181096 values_sz:362481
itemid:181084 values_sz:362112
itemid:181075 values_sz:361620
itemid:181087 values_sz:360554
itemid:181108 values_sz:358258
itemid:181081 values_sz:358012
itemid:181102 values_sz:357971
itemid:181093 values_sz:356167
itemid:55027 values_sz:351490
itemid:55025 values_sz:351358
itemid:173309 values_sz:306270
itemid:173360 values_sz:306270
itemid:173357 values_sz:304425
itemid:173306 values_sz:304425
itemid:173366 values_sz:303769
==
//
//
zabbix_server -V
zabbix_server (Zabbix) 7.0.15
Revision d72b831a577 18 June 2025, compilation time: Jun 20 2025 11:37:38
Copyright (C) 2025 Zabbix SIA
License AGPLv3: GNU Affero General Public License version 3 <https://www.gnu.org/licenses/>.
This is free software: you are free to change and redistribute it according to
the license. There is NO WARRANTY, to the extent permitted by law.
This product includes software developed by the OpenSSL Project
for use in the OpenSSL Toolkit (http://www.openssl.org/).
Compiled with OpenSSL 3.0.13 30 Jan 2024
Running with OpenSSL 3.0.13 30 Jan 2024
//
|
|
Could you please be so kind and share what is preprocessing for following items ?
Top.peak:
itemid:181033 tasks:841
itemid:180998 tasks:841
itemid:181034 tasks:840
itemid:180999 tasks:840
|
|
Yes, ofcourse hereby the output:
[ RECORD 1 ]-------+-------------------------------------------------------------------------
itemid | 180998
type | 7
snmp_oid |
hostid | 10886
name | fbsnap2: Get stats
key_ | vfs.file.contents[/sys/block/fbsnap2/stat]
delay | 1m
history | 0
trends | 0
status | 0
value_type | 4
trapper_hosts |
units |
formula |
logtimefmt |
templateid |
valuemapid |
params |
ipmi_sensor |
authtype | 0
username |
password |
publickey |
privatekey |
flags | 4
interfaceid |
description | The contents of get `/sys/block/fbsnap2/stat` to get the disk statistics.
inventory_link | 0
lifetime | 7d
evaltype | 0
jmx_endpoint |
master_itemid |
timeout |
url |
query_fields |
posts |
status_codes | 200
follow_redirects | 1
post_type | 0
http_proxy |
headers |
retrieve_mode | 0
request_method | 0
output_format | 0
ssl_cert_file |
ssl_key_file |
ssl_key_password |
verify_peer | 0
verify_host | 0
allow_traps | 0
discover | 0
uuid |
lifetime_type | 0
enabled_lifetime_type | 2
enabled_lifetime | 0
[ RECORD 2 ]-------+-------------------------------------------------------------------------
itemid | 180999
type | 18
snmp_oid |
hostid | 10886
name | fbsnap2: Disk write time (rate)
key_ | vfs.dev.write.time.rate[fbsnap2]
delay | 0
history | 31d
trends | 365d
status | 0
value_type | 0
trapper_hosts |
units |
formula |
logtimefmt |
templateid |
valuemapid |
params |
ipmi_sensor |
authtype | 0
username |
password |
publickey |
privatekey |
flags | 4
interfaceid |
description | The rate of total write time counter; used in `w_await` calculation.
inventory_link | 0
lifetime | 7d
evaltype | 0
jmx_endpoint |
master_itemid | 180998
timeout |
url |
query_fields |
posts |
status_codes | 200
follow_redirects | 1
post_type | 0
http_proxy |
headers |
retrieve_mode | 0
request_method | 0
output_format | 0
ssl_cert_file |
ssl_key_file |
ssl_key_password |
verify_peer | 0
verify_host | 0
allow_traps | 0
discover | 0
uuid |
lifetime_type | 0
enabled_lifetime_type | 2
enabled_lifetime | 0
[ RECORD 3 ]-------+-------------------------------------------------------------------------
itemid | 181033
type | 7
snmp_oid |
hostid | 10886
name | fbdisk0: Get stats
key_ | vfs.file.contents[/sys/block/fbdisk0/stat]
delay | 1m
history | 0
trends | 0
status | 0
value_type | 4
trapper_hosts |
units |
formula |
logtimefmt |
templateid |
valuemapid |
params |
ipmi_sensor |
authtype | 0
username |
password |
publickey |
privatekey |
flags | 4
interfaceid |
description | The contents of get `/sys/block/fbdisk0/stat` to get the disk statistics.
inventory_link | 0
lifetime | 7d
evaltype | 0
jmx_endpoint |
master_itemid |
timeout |
url |
query_fields |
posts |
status_codes | 200
follow_redirects | 1
post_type | 0
http_proxy |
headers |
retrieve_mode | 0
request_method | 0
output_format | 0
ssl_cert_file |
ssl_key_file |
ssl_key_password |
verify_peer | 0
verify_host | 0
allow_traps | 0
discover | 0
uuid |
lifetime_type | 0
enabled_lifetime_type | 2
enabled_lifetime | 0
[ RECORD 4 ]-------+-------------------------------------------------------------------------
itemid | 181034
type | 18
snmp_oid |
hostid | 10886
name | fbdisk0: Disk write time (rate)
key_ | vfs.dev.write.time.rate[fbdisk0]
delay | 0
history | 31d
trends | 365d
status | 0
value_type | 0
trapper_hosts |
units |
formula |
logtimefmt |
templateid |
valuemapid |
params |
ipmi_sensor |
authtype | 0
username |
password |
publickey |
privatekey |
flags | 4
interfaceid |
description | The rate of total write time counter; used in `w_await` calculation.
inventory_link | 0
lifetime | 7d
evaltype | 0
jmx_endpoint |
master_itemid | 181033
timeout |
url |
query_fields |
posts |
status_codes | 200
follow_redirects | 1
post_type | 0
http_proxy |
headers |
retrieve_mode | 0
request_method | 0
output_format | 0
ssl_cert_file |
ssl_key_file |
ssl_key_password |
verify_peer | 0
verify_host | 0
allow_traps | 0
discover | 0
uuid |
lifetime_type | 0
enabled_lifetime_type | 2
enabled_lifetime | 0
|
|
We've not experienced the issue up until today on our Debian 12 6.1.0-37-amd64 install when we moved the zabbix-server-pgsql package up to 7.2.9. At this point the "preprocessing manager" process pegged at ~98%. We only solved the issue by back revving packages to 7.2.7: zabbix-server-pgsql zabbix-agent2-plugin-postgresql zabbix-agent2 zabbix-apache-conf zabbix-frontend-php zabbix-get zabbix-sql-scripts. We have no proxy in place.
|
|
Fixed under ZBX-26610
|
Generated at Sat May 09 18:10:32 EEST 2026 using Jira 10.3.18#10030018-sha1:5642e4ad348b6c2a83ebdba689d04763a2393cab.