[ZBX-27277] Memory usage values collected from VMware discovery do not match the memory metrics collected from the OS-level Zabbix agent. Additionally, “Active Memory” metrics cannot be retrieved for discovered VMware VMs. Created: 2025 Nov 28 Updated: 2026 Apr 22 |
|
| Status: | Need info |
| Project: | ZABBIX BUGS AND ISSUES |
| Component/s: | None |
| Affects Version/s: | None |
| Fix Version/s: | None |
| Type: | Incident report | Priority: | Trivial |
| Reporter: | Yasin | Assignee: | Zabbix Support Team |
| Resolution: | Unresolved | Votes: | 0 |
| Labels: | VMware | ||
| Remaining Estimate: | Not Specified | ||
| Time Spent: | Not Specified | ||
| Original Estimate: | Not Specified | ||
| Attachments: |
|
| Description |
|
We are experiencing inconsistent memory usage values between VMware-based monitoring and OS-level monitoring in Zabbix. Issue Details:
Environment:
Steps to Reproduce:
Expected Result:
Actual Result:
|
| Comments |
| Comment by Alexey Pustovalov [ 2025 Dec 02 ] | ||||||
|
Please provide more detailed technical information, just description of the problem is not enough! | ||||||
| Comment by Yasin [ 2026 Jan 12 ] | ||||||
1. Environment
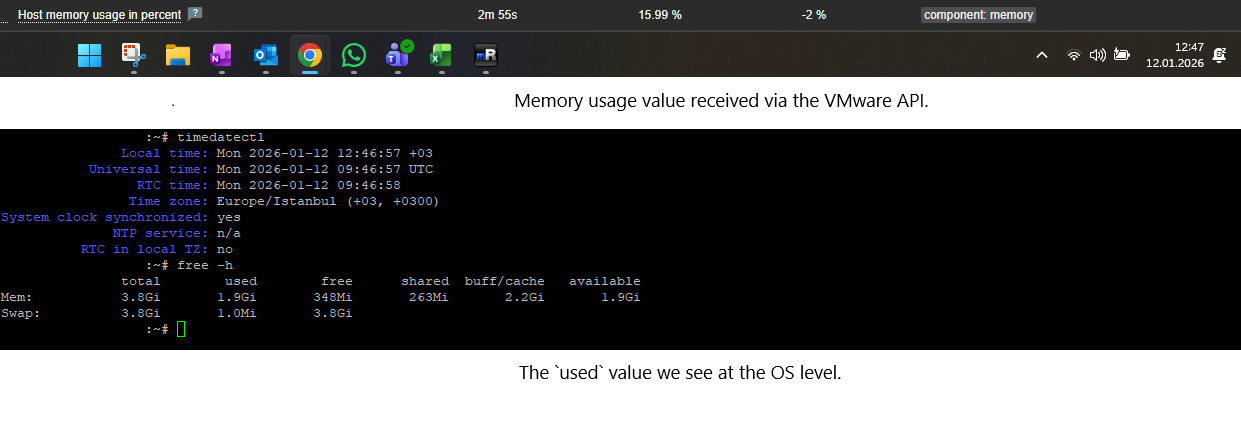
2. Timestamp Correlation (Important)The attached screenshot was taken at:
{{Local time: Mon 2026-01-12 12:46:57 +03
UTC time:   Mon 2026-01-12 09:46:57 UTC}}
Zabbix VMware and OS-level metrics were checked at the same time window (±1 minute) to eliminate timing skew. 3. OS-Level Memory (Ground Truth – Guest Perspective)Command executed inside the VM:
{{free -h}}
Result (from screenshot):
{{Mem:
  total:     3.8 GiB
  used:      1.9 GiB
  free:      348 MiB
  buff/cache:263 MiB
  available: 2.2 GiB}}
➡ Key interpretation (Linux memory model):
From OS perspective:
4. VMware-Based Metrics (Zabbix)At the same timestamp, Zabbix VMware items report significantly different values: Examples:
 * {{vmware.vm.memory.usage}} → *~15–35%* (varies)

 * {{vmware.vm.memory.used}} → does not correlate with OS {{used}}

 * {{vmware.vm.memory.consumed}} → much higher than OS usage
This leads to contradicting interpretations:
5. Missing / Unsupported “Active Memory”VMware defines Active Memory as:
Observations:
Because of this:
6. Root Cause (Technical Analysis)This discrepancy is not a bug in the OS or agent, but a semantic mismatch:
Without Active Memory, VMware metrics:
7. Impact
8. Requested Clarification from ZabbixPlease clarify one of the following:
9. ConclusionAt the moment, there is no consistent or reliable way to correlate VMware memory metrics with actual guest OS memory usage in Zabbix. Until this is clarified, OS-level memory metrics are the only trustworthy source for alerting, while VMware-based metrics remain ambiguous. | ||||||
| Comment by Tomasz Grzechulski [ 2026 Mar 16 ] | ||||||
|
hello, | ||||||
| Comment by Yasin [ 2026 Mar 17 ] | ||||||
|
Hi tgrzechulski , Version 7.0-2 is being used. | ||||||
| Comment by Yasin [ 2026 Apr 22 ] | ||||||
|
Hi tgrzechulski , Following the request for deeper technical details, we performed direct validation against the VMware API using the govc CLI tool (which uses the same vSphere API as Zabbix). 1. VMware API Validation (Independent from Zabbix)We verified that Active Memory metrics are actually available at the VMware level: govc metric.ls "/Datacenter/vm/ZabbixNew/vmzbx01" | grep mem.active Result: mem.active.average We then successfully retrieved the metric: govc metric.sample -n 1 "/Datacenter/vm/ZabbixNew/vmzbx01" mem.active.average Output: mem.active.average 335544 KB This confirms:
2. Zabbix BehaviorDespite the metric being available in VMware:
Unsupported item key
{{vmware.vm.memory.active\\{$VMWARE.URL},\\{$VMWARE.VM.UUID} 3. Root Cause (Technical Explanation)Based on investigation:
This means: Even if a metric exists in VMware (e.g. mem.active.average), 4. Key Limitation Identified
Therefore: Zabbix cannot retrieve Active Memory at all, regardless of configuration 5. ImplicationThis explains the original issue described in the ticket :
6. Conclusion
This is a Zabbix limitation in VMware integration Requested ClarificationCould you please confirm:
Additional NoteGiven the current limitation: OS-level metrics (via Zabbix Agent) remain the only reliable source for:
VMware metrics alone are insufficient without Active Memory. Thank you. |