|
What database backend you use?
|
|
postgresql 9.3
|
|
Related to ZBX-6995.
|
|
Please attach explain of this query and database schema:
|
|
query explain and DB dump in attach
|
|
We can't reproduce the issue on original DB scheme. Your scheme contains mass of custom changes, therefore execution plan of this statement a bit different.
I'm closing the issue.
|
|
Hello! I reopened issue because the problem remains, and current workaround (set all users superadmin) any more
isn't suitable, now we needed to realize access restriction based on groups.
DB scheme custom changes - it is only few new created indexes, unsuccess attempt to solve a problem. Now DB
restored to original state, but problem remains.
In addition to the first message: almost all data items, graphs were generated by LLD rules.
We can provide you remote access to the zabbix and DB interface, if it helps to solve issue and it is convenient for you.
|
|
Hi everyone,
I've been doing some research on this, and there might be a bug in some of the queries regarding permissions.
Mysql Environment description (Frontend is on a different machine):
HW:
- RAM: 8GB
- CPU: 8 Core Intel Xeon(R) CPU E5640 @ 2.67GHz
- DataDir mounted over Logical Volume, Stripped over 3 Physical Disks
Zabbix:
- Hosts: 14635 (14206 active)
- Items: 26673
- Users: 56
Case:
The following query takes over 50 seconds:
SELECT DISTINCT g.*
FROM groups g,
rights r,
users_groups ug,
hosts_groups hg,
hosts h
WHERE r.id=g.groupid
AND r.groupid=ug.usrgrpid
AND hg.groupid=g.groupid
AND h.hostid=hg.hostid
AND ug.userid=100100000000013
AND r.permission>=3
AND NOT EXISTS (
SELECT gg.groupid
FROM groups gg,
rights rr,
users_groups ugg
WHERE rr.id=g.groupid
AND rr.groupid=ugg.usrgrpid
AND ugg.userid=100100000000013
AND rr.permission<3)
AND h.status IN(0,1)
AND g.groupid BETWEEN 100000000000000 AND 199999999999999;
In some cases it can take up to 15 minutes.
It seems like the NOT EXISTS subquery is penalizing the most on the overall query.
I'll test some other type of query structure using subselects which might speed things up.
Although it might eventually be only valid for engines fully supporting subqueries, it still might be a starting point.
Cheers!!
|
|
One more thing I forgot to mention:
The following query got the exact same result in less than 0.3 seconds:
SELECT g.*
FROM groups g
WHERE g.groupid IN (
SELECT hg.groupid FROM hosts_groups hg WHERE hg.hostid IN (
SELECT h.hostid FROM hosts h WHERE h.status IN (1,0)
)
)
AND g.groupid NOT IN (
SELECT r.id FROM rights r WHERE permission < 3 AND groupid IN (
SELECT ug.id FROM users_groups ug WHERE userid=100100000000013
)
)
AND g.groupid IN (
SELECT rr.id FROM rights r WHERE permission >= 3
);
Could this query modification be implemented in the Zabbix frontend code (I'm currently using version 2.0.3)?
I could check and restructure more queries for optimization. If I can be of help, please let me know.
Cheers!
|
|
I have the same problem. Installing version 2.4.1 does not helps.
Takes over 90 seconds:
SELECT DISTINCT g.graphid,g.name FROM graphs g,graphs_items gi,items i,hosts_groups hg,hosts h WHERE NOT EXISTS (SELECT NULL FROM graphs_items gi,items i,hosts_groups hgg LEFT JOIN rights r ON r.id=hgg.groupid AND r.groupid IN ('11','22','34') WHERE g.graphid=gi.graphid AND gi.itemid=i.itemid AND i.hostid=hgg.hostid GROUP BY i.hostid HAVING MAX(permission)<'2' OR MIN(permission) IS NULL OR MIN(permission)=0) AND NOT EXISTS (SELECT NULL FROM items i,hosts_groups hgg LEFT JOIN rights r ON r.id=hgg.groupid AND r.groupid IN ('11','22','34') WHERE g.ymin_type=2 AND g.ymin_itemid=i.itemid AND i.hostid=hgg.hostid GROUP BY i.hostid HAVING MAX(permission)<'2' OR MIN(permission) IS NULL OR MIN(permission)=0) AND NOT EXISTS (SELECT NULL FROM items i,hosts_groups hgg LEFT JOIN rights r ON r.id=hgg.groupid AND r.groupid IN ('11','22','34') WHERE g.ymax_type=2 AND g.ymax_itemid=i.itemid AND i.hostid=hgg.hostid GROUP BY i.hostid HAVING MAX(permission)<'2' OR MIN(permission) IS NULL OR MIN(permission)=0) AND hg.groupid='96' AND hg.hostid=i.hostid AND gi.graphid=g.graphid AND i.itemid=gi.itemid AND g.graphid=gi.graphid AND h.hostid=i.hostid AND h.status<>3 AND g.flags IN ('0','4')
|
|
Zabbix 2.4.1 - issue remains
|
|
Your code is fine, but the performance gains needs to be verified on different database engines with large number of hosts and host groups. The IN() optimization is quite tricky, our experience tell us that such optimizations may have some unpredicted behavior.
Anyway, we need to do performance tests on large systems before applying your patch.
|
|
These queries kill our DB, they use tmp tables, and we ask to fix them as soon as possible:
EXPLAIN SELECT DISTINCT t.triggerid,t.state,t.error,t.url,t.expression,t.description,t.priority,t.lastchange FROM triggers t,functions f,items i,hosts_groups hg WHERE NOT EXISTS (SELECT NULL FROM functions f,items i,hosts_groups hgg LEFT JOIN rights r ON r.id=hgg.groupid AND r.groupid='8' WHERE t.triggerid=f.triggerid AND f.itemid=i.itemid AND i.hostid=hgg.hostid GROUP BY i.hostid HAVING MAX(permission)<2 OR MIN(permission) IS NULL OR MIN(permission)=0) AND hg.hostid=i.hostid AND f.triggerid=t.triggerid AND f.itemid=i.itemid AND hg.groupid='20' AND NOT EXISTS (SELECT NULL FROM functions f,items i,hosts h WHERE t.triggerid=f.triggerid AND f.itemid=i.itemid AND i.hostid=h.hostid AND (i.status<>0 OR h.status<>0)) AND t.status=0 AND t.value='1' AND t.flags IN ('0','4') ORDER BY t.lastchange DESC LIMIT 50 OFFSET 0
id select_type table type possible_keys key key_len ref rows Extra
1 PRIMARY f index functions_1,functions_2 functions_1 16 null 77152 Using where; Using index; Using temporary; Using filesort
1 PRIMARY t eq_ref PRIMARY,triggers_1,triggers_2 PRIMARY 8 zabbix_tokunew226.f.triggerid 1 Using where
1 PRIMARY i eq_ref PRIMARY,items_1 PRIMARY 8 zabbix_tokunew226.f.itemid 1 Distinct
1 PRIMARY hg eq_ref hosts_groups_1,hosts_groups_2 hosts_groups_1 16 zabbix_tokunew226.i.hostid,const 1 Using index; Distinct
3 MATERIALIZED f index functions_1,functions_2 functions_1 16 null 77152 Using index
3 MATERIALIZED i eq_ref PRIMARY,items_1,items_3,items_4,items_5,items_6 PRIMARY 8 zabbix_tokunew226.f.itemid 1
3 MATERIALIZED h eq_ref PRIMARY,hosts_1,hosts_2,hosts_3,hosts_4,hosts_5,c_hosts_3 PRIMARY 8 zabbix_tokunew226.i.hostid 1 Using where
2 DEPENDENT SUBQUERY f ref functions_1,functions_2 functions_1 8 zabbix_tokunew226.t.triggerid 7716 Using index; Using temporary; Using filesort
2 DEPENDENT SUBQUERY i eq_ref PRIMARY,items_1 PRIMARY 8 zabbix_tokunew226.f.itemid 1
2 DEPENDENT SUBQUERY hgg ref hosts_groups_1 hosts_groups_1 8 zabbix_tokunew226.i.hostid 22 Using index
2 DEPENDENT SUBQUERY r ref rights_1,rights_2 rights_1 8 const 10 Using where
|
|
I changed index 'functions_1' on functions to use 2 fields: triggerid, itemid. But query still uses tmp tables for distinct sorting.
|
|
And this one:
EXPLAIN SELECT DISTINCT COUNT(DISTINCT t.triggerid) AS rowscount FROM triggers t,functions f,items i,hosts_groups hg WHERE NOT EXISTS (SELECT NULL FROM functions f,items i,hosts_groups hgg LEFT JOIN rights r ON r.id=hgg.groupid AND r.groupid='11' WHERE t.triggerid=f.triggerid AND f.itemid=i.itemid AND i.hostid=hgg.hostid GROUP BY i.hostid HAVING MAX(permission)<2 OR MIN(permission) IS NULL OR MIN(permission)=0) AND hg.hostid=i.hostid AND f.triggerid=t.triggerid AND f.itemid=i.itemid AND hg.groupid='20' AND NOT EXISTS (SELECT NULL FROM functions f,items i,hosts h WHERE t.triggerid=f.triggerid AND f.itemid=i.itemid AND i.hostid=h.hostid AND (i.status<>0 OR h.status<>0)) AND t.status=0 AND t.value='1' AND t.flags IN ('0','4')
id select_type table type possible_keys key key_len ref rows Extra
1 PRIMARY f index functions_1,functions_2 functions_1 16 null 77152 Using where; Using index
1 PRIMARY t eq_ref PRIMARY,triggers_1,triggers_2 PRIMARY 8 zabbix_tokunew226.f.triggerid 1 Using where
1 PRIMARY i eq_ref PRIMARY,items_1 PRIMARY 8 zabbix_tokunew226.f.itemid 1
1 PRIMARY hg eq_ref hosts_groups_1,hosts_groups_2 hosts_groups_1 16 zabbix_tokunew226.i.hostid,const 1 Using index
3 MATERIALIZED f index functions_1,functions_2 functions_1 16 null 77152 Using index
3 MATERIALIZED i eq_ref PRIMARY,items_1,items_3,items_4,items_5,items_6 PRIMARY 8 zabbix_tokunew226.f.itemid 1
3 MATERIALIZED h eq_ref PRIMARY,hosts_1,hosts_2,hosts_3,hosts_4,hosts_5,c_hosts_3 PRIMARY 8 zabbix_tokunew226.i.hostid 1 Using where
2 DEPENDENT SUBQUERY f ref functions_1,functions_2 functions_1 8 zabbix_tokunew226.t.triggerid 7716 Using index; Using temporary; Using filesort
2 DEPENDENT SUBQUERY i eq_ref PRIMARY,items_1 PRIMARY 8 zabbix_tokunew226.f.itemid 1
2 DEPENDENT SUBQUERY hgg ref hosts_groups_1 hosts_groups_1 8 zabbix_tokunew226.i.hostid 22 Using index
2 DEPENDENT SUBQUERY r ref rights_1,rights_2 rights_2 8 zabbix_tokunew226.hgg.groupid 11 Using where
|
|
Hello Alexei!
David Szanto method work for me. (I have Postresql as backend 5600 hosts, 280000 items, he Mysql)
|
|
I changed CGraph.php to check permissions like this:
// check permissions by graph items
$sqlParts['where'][] = 'NOT EXISTS ('.
'SELECT NULL'.
' FROM graphs_items gi,items i'.
' WHERE g.graphid=gi.graphid'.
' AND gi.itemid=i.itemid'.
' AND i.hostid in ('.
' SELECT hgg.hostid FROM hosts_groups hgg '.' LEFT JOIN rights r'.
' ON r.id=hgg.groupid'.
' AND '.dbConditionInt('r.groupid', $userGroups).
' GROUP BY hgg.hostid'.
' HAVING MAX(permission)<'.zbx_dbstr($permission).
' OR MIN(permission) IS NULL'.
' OR MIN(permission)='.PERM_DENY.
')'.
')';
This makes it manageable for us with minimal changes to the code. We have 243 hosts, 40625 items and 14448 graphs, db is postgresql.
|
|
Hello,
Is this problem solved in Zabbix 3.0.0 ?
Best Regards,
|
|
Hello,
We're using version 3.0.4 and we're the same problem. It is just very slow for non super-admins.
|
|
Well, I'd argue it's currently (rel. 3.0.7) even too slow for Zabbix-Super-Admins.
It might be considered as nitpicking, but shouldn't preparation of all control/navigation objects of a site not take longer than 1 second? Currently already only selecting items for a single combo-box may take more than a second.
It would be nice, if one would only wait for mass-data related tasks - that's to say, decouple control/navigation objects from large tables like e.g. the items table.
 Sort  (cost=114605.41..114606.15 rows=297 width=32) (actual time=1624.535..1624.549 rows=226 loops=1)
   Sort Key: g.name
   Sort Method: quicksort  Memory: 43kB
   ->  Hash Join  (cost=114582.80..114593.21 rows=297 width=32) (actual time=1623.941..1624.071 rows=226 loops=1)
         Hash Cond: (g.groupid = hg.groupid)
         ->  Seq Scan on groups g  (cost=0.00..6.23 rows=323 width=32) (actual time=0.006..0.047 rows=324 loops=1)
         ->  Hash  (cost=114579.09..114579.09 rows=297 width=8) (actual time=1623.924..1623.924 rows=226 loops=1)
               Buckets: 1024  Batches: 1  Memory Usage: 9kB
               ->  HashAggregate  (cost=114576.12..114579.09 rows=297 width=8) (actual time=1623.831..1623.859 rows=226 loops=1)
                     ->  Hash Join  (cost=82392.43..113433.37 rows=457101 width=8) (actual time=615.090..1462.765 rows=912260 loops=1)
                           Hash Cond: (i.hostid = hg.hostid)
                           ->  Hash Join  (cost=82141.94..101154.95 rows=198851 width=16) (actual time=612.038..1256.090 rows=244840 loops=1)
                                 Hash Cond: (f.triggerid = t.triggerid)
                                 ->  Hash Join  (cost=65060.75..79240.67 rows=227567 width=24) (actual time=437.041..840.343 rows=275958 loops=1)
                                       Hash Cond: (f.itemid = i.itemid)
                                       ->  Seq Scan on functions f  (cost=0.00..8497.00 rows=454300 width=16) (actual time=0.007..60.152 rows=451860 loops=1)
                                       ->  Hash  (cost=61616.33..61616.33 rows=275553 width=24) (actual time=436.813..436.813 rows=319238 loops=1)
                                             Buckets: 32768  Batches: 1  Memory Usage: 17459kB
                                             ->  Hash Join  (cost=3473.68..61616.33 rows=275553 width=24) (actual time=1.533..357.917 rows=319238 loops=1)
                                                   Hash Cond: (i.hostid = h.hostid)
                                                   ->  Seq Scan on items i  (cost=0.00..53073.19 rows=462788 width=16) (actual time=0.011..237.129 rows=462781 loops=1)
                                                         Filter: (status = 0)
                                                         Rows Removed by Filter: 87313
                                                   ->  Hash  (cost=3446.38..3446.38 rows=2184 width=8) (actual time=1.513..1.513 rows=2184 loops=1)
                                                         Buckets: 1024  Batches: 1  Memory Usage: 86kB
                                                         ->  Bitmap Heap Scan on hosts h  (cost=129.21..3446.38 rows=2184 width=8) (actual time=0.259..1.076 rows=2184 l
oops=1)
                                                               Recheck Cond: (status = 0)
                                                               ->  Bitmap Index Scan on hosts_2  (cost=0.00..128.66 rows=2184 width=0) (actual time=0.223..0.223 rows=21
84 loops=1)
                                                                     Index Cond: (status = 0)
                                 ->  Hash  (cost=13863.64..13863.64 rows=257404 width=8) (actual time=174.855..174.855 rows=256169 loops=1)
                                       Buckets: 32768  Batches: 1  Memory Usage: 10007kB
                                       ->  Seq Scan on triggers t  (cost=0.00..13863.64 rows=257404 width=8) (actual time=0.007..121.855 rows=256169 loops=1)
                                             Filter: ((flags = ANY ('{0,4}'::integer[])) AND (status = 0))
                                             Rows Removed by Filter: 38407
                           ->  Hash  (cost=142.44..142.44 rows=8644 width=16) (actual time=3.046..3.046 rows=8727 loops=1)
                                 Buckets: 1024  Batches: 1  Memory Usage: 410kB
                                 ->  Seq Scan on hosts_groups hg  (cost=0.00..142.44 rows=8644 width=16) (actual time=0.005..1.386 rows=8727 loops=1)
 Total runtime: 1624.661 ms
 Sort  (cost=111787.75..111788.50 rows=297 width=32) (actual time=1684.302..1684.317 rows=226 loops=1)
   Sort Key: g.name
   Sort Method: quicksort  Memory: 43kB
   ->  Hash Join  (cost=111765.14..111775.55 rows=297 width=32) (actual time=1683.699..1683.832 rows=226 loops=1)
         Hash Cond: (g.groupid = hg.groupid)
         ->  Seq Scan on groups g  (cost=0.00..6.23 rows=323 width=32) (actual time=0.009..0.047 rows=324 loops=1)
         ->  Hash  (cost=111761.43..111761.43 rows=297 width=8) (actual time=1683.677..1683.677 rows=226 loops=1)
               Buckets: 1024  Batches: 1  Memory Usage: 9kB
               ->  HashAggregate  (cost=111758.46..111761.43 rows=297 width=8) (actual time=1683.583..1683.617 rows=226 loops=1)
                     ->  Hash Join  (cost=103640.59..110586.93 rows=468612 width=8) (actual time=1370.259..1530.788 rows=912260 loops=1)
                           Hash Cond: (hg.hostid = h.hostid)
                           ->  Seq Scan on hosts_groups hg  (cost=0.00..142.44 rows=8644 width=16) (actual time=0.006..1.180 rows=8727 loops=1)
                           ->  Hash  (cost=101154.95..101154.95 rows=198851 width=16) (actual time=1370.095..1370.095 rows=244840 loops=1)
                                 Buckets: 32768  Batches: 1  Memory Usage: 11477kB
                                 ->  Hash Join  (cost=82141.94..101154.95 rows=198851 width=16) (actual time=635.482..1312.496 rows=244840 loops=1)
                                       Hash Cond: (f.triggerid = t.triggerid)
                                       ->  Hash Join  (cost=65060.75..79240.67 rows=227567 width=24) (actual time=437.136..875.663 rows=275958 loops=1)
                                             Hash Cond: (f.itemid = i.itemid)
                                             ->  Seq Scan on functions f  (cost=0.00..8497.00 rows=454300 width=16) (actual time=0.007..60.634 rows=451860 loops=1)
                                             ->  Hash  (cost=61616.33..61616.33 rows=275553 width=24) (actual time=436.878..436.878 rows=319238 loops=1)
                                                   Buckets: 32768  Batches: 1  Memory Usage: 17459kB
                                                   ->  Hash Join  (cost=3473.68..61616.33 rows=275553 width=24) (actual time=1.578..357.381 rows=319238 loops=1)
                                                         Hash Cond: (i.hostid = h.hostid)
                                                         ->  Seq Scan on items i  (cost=0.00..53073.19 rows=462788 width=16) (actual time=0.006..239.487 rows=462781 loo
ps=1)
                                                               Filter: (status = 0)
                                                               Rows Removed by Filter: 87313
                                                         ->  Hash  (cost=3446.38..3446.38 rows=2184 width=8) (actual time=1.563..1.563 rows=2184 loops=1)
                                                               Buckets: 1024  Batches: 1  Memory Usage: 86kB
                                                               ->  Bitmap Heap Scan on hosts h  (cost=129.21..3446.38 rows=2184 width=8) (actual time=0.259..1.102 rows=
2184 loops=1)
                                                                     Recheck Cond: (status = 0)
                                                                     ->  Bitmap Index Scan on hosts_2  (cost=0.00..128.66 rows=2184 width=0) (actual time=0.225..0.225 r
ows=2184 loops=1)
                                                                           Index Cond: (status = 0)
                                       ->  Hash  (cost=13863.64..13863.64 rows=257404 width=8) (actual time=198.142..198.142 rows=256169 loops=1)
                                             Buckets: 32768  Batches: 1  Memory Usage: 10007kB
                                             ->  Seq Scan on triggers t  (cost=0.00..13863.64 rows=257404 width=8) (actual time=0.011..137.369 rows=256169 loops=1)
                                                   Filter: ((flags = ANY ('{0,4}'::integer[])) AND (status = 0))
                                                   Rows Removed by Filter: 38407
 Total runtime: 1684.472 ms
(38 rows)
 Nested Loop  (cost=102321.41..103198.15 rows=1735 width=29) (actual time=1309.486..1317.659 rows=1920 loops=1)
   ->  HashAggregate  (cost=102321.13..102345.71 rows=2458 width=8) (actual time=1309.438..1310.208 rows=2759 loops=1)
         ->  Hash Join  (cost=75939.23..101486.21 rows=333968 width=8) (actual time=529.790..1248.507 rows=318453 loops=1)
               Hash Cond: (f.triggerid = t.triggerid)
               ->  Hash Join  (cost=58858.04..76287.88 rows=382197 width=16) (actual time=346.416..775.859 rows=364445 loops=1)
                     Hash Cond: (f.itemid = i.itemid)
                     ->  Seq Scan on functions f  (cost=0.00..8497.00 rows=454300 width=16) (actual time=0.006..62.724 rows=451860 loops=1)
                     ->  Hash  (cost=53073.19..53073.19 rows=462788 width=16) (actual time=346.113..346.113 rows=462781 loops=1)
                           Buckets: 65536  Batches: 1  Memory Usage: 21693kB
                           ->  Seq Scan on items i  (cost=0.00..53073.19 rows=462788 width=16) (actual time=0.007..238.878 rows=462781 loops=1)
                                 Filter: (status = 0)
                                 Rows Removed by Filter: 87313
               ->  Hash  (cost=13863.64..13863.64 rows=257404 width=8) (actual time=183.339..183.339 rows=256169 loops=1)
                     Buckets: 32768  Batches: 1  Memory Usage: 10007kB
                     ->  Seq Scan on triggers t  (cost=0.00..13863.64 rows=257404 width=8) (actual time=0.008..130.098 rows=256169 loops=1)
                           Filter: ((flags = ANY ('{0,4}'::integer[])) AND (status = 0))
                           Rows Removed by Filter: 38407
   ->  Index Scan using hosts_pkey on hosts h  (cost=0.28..0.34 rows=1 width=29) (actual time=0.002..0.002 rows=1 loops=2759)
         Index Cond: (hostid = i.hostid)
         Filter: ((flags = ANY ('{0,4}'::integer[])) AND (status = 0))
         Rows Removed by Filter: 0
 Total runtime: 1317.878 ms
(22 rows)
 Sort  (cost=93002.55..93003.29 rows=297 width=32) (actual time=1089.289..1089.303 rows=222 loops=1)
   Sort Key: g.name
   Sort Method: quicksort  Memory: 42kB
   ->  Hash Join  (cost=92979.94..92990.35 rows=297 width=32) (actual time=1088.718..1088.846 rows=222 loops=1)
         Hash Cond: (g.groupid = hg.groupid)
         ->  Seq Scan on groups g  (cost=0.00..6.23 rows=323 width=32) (actual time=0.017..0.055 rows=324 loops=1)
         ->  Hash  (cost=92976.23..92976.23 rows=297 width=8) (actual time=1088.692..1088.692 rows=222 loops=1)
               Buckets: 1024  Batches: 1  Memory Usage: 9kB
               ->  HashAggregate  (cost=92973.26..92976.23 rows=297 width=8) (actual time=1088.608..1088.637 rows=222 loops=1)
                     ->  Hash Join  (cost=65384.56..91838.88 rows=453751 width=8) (actual time=362.953..967.799 rows=678985 loops=1)
                           Hash Cond: (i.hostid = hg.hostid)
                           ->  Hash Join  (cost=61300.04..76003.35 rows=217042 width=8) (actual time=339.397..790.060 rows=217628 loops=1)
                                 Hash Cond: (gi.itemid = i.itemid)
                                 ->  Hash Join  (cost=2725.90..12545.77 rows=217042 width=8) (actual time=40.118..202.093 rows=217628 loops=1)
                                       Hash Cond: (gi.graphid = gr.graphid)
                                       ->  Seq Scan on graphs_items gi  (cost=0.00..4735.31 rows=233131 width=16) (actual time=0.006..48.868 rows=226715 loops=1)
                                       ->  Hash  (cost=1946.83..1946.83 rows=62326 width=8) (actual time=40.052..40.052 rows=58504 loops=1)
                                             Buckets: 8192  Batches: 1  Memory Usage: 2286kB
                                             ->  Seq Scan on graphs gr  (cost=0.00..1946.83 rows=62326 width=8) (actual time=0.038..27.789 rows=58504 loops=1)
                                                   Filter: (flags = ANY ('{0,4}'::integer[]))
                                                   Rows Removed by Filter: 4264
                                 ->  Hash  (cost=51697.95..51697.95 rows=550095 width=16) (actual time=298.983..298.983 rows=550094 loops=1)
                                       Buckets: 65536  Batches: 1  Memory Usage: 25786kB
                                       ->  Seq Scan on items i  (cost=0.00..51697.95 rows=550095 width=16) (actual time=0.004..175.501 rows=550094 loops=1)
                           ->  Hash  (cost=3988.67..3988.67 rows=7668 width=24) (actual time=23.516..23.516 rows=8303 loops=1)
                                 Buckets: 1024  Batches: 1  Memory Usage: 455kB
                                 ->  Hash Join  (cost=3715.53..3988.67 rows=7668 width=24) (actual time=17.097..21.614 rows=8303 loops=1)
                                       Hash Cond: (hg.hostid = h.hostid)
                                       ->  Seq Scan on hosts_groups hg  (cost=0.00..142.44 rows=8644 width=16) (actual time=0.004..1.106 rows=8727 loops=1)
                                       ->  Hash  (cost=3674.85..3674.85 rows=3254 width=8) (actual time=17.084..17.084 rows=3254 loops=1)
                                             Buckets: 1024  Batches: 1  Memory Usage: 128kB
                                             ->  Seq Scan on hosts h  (cost=0.00..3674.85 rows=3254 width=8) (actual time=0.011..16.529 rows=3254 loops=1)
                                                   Filter: (status = ANY ('{0,1}'::integer[]))
                                                   Rows Removed by Filter: 414
 Total runtime: 1089.396 ms
(35 rows)
|
|
Briefly described possible improvements in attached PDF zbx-7706-report.pdf
Changes mentioned also attached as patches:
group-selection-in-main-query.patch
join-subquery-2-and-3-into-one-subquery.patch
limit-subquery-2-and-3.patch
|
|
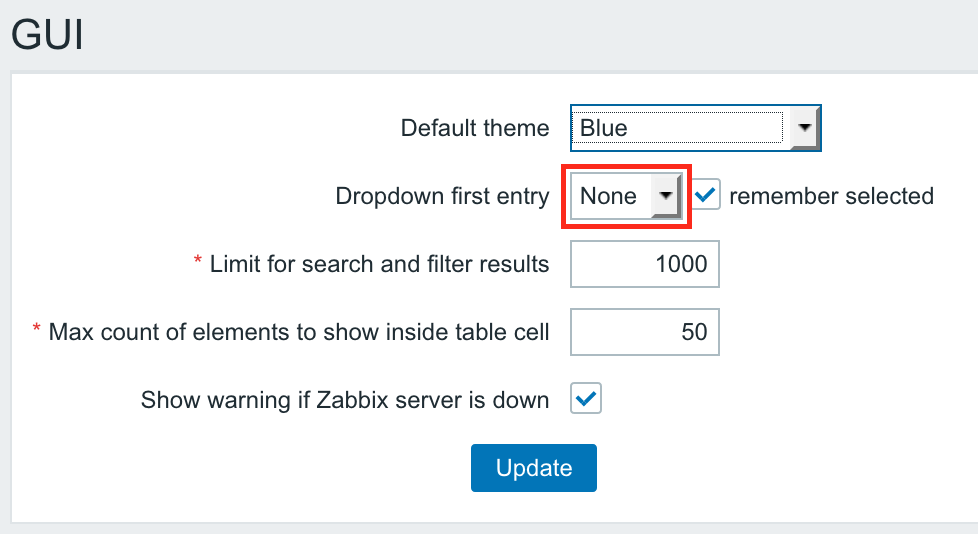
We don't see way to increase the performance of this SQL statement.
As a workaround, the “Drop down first entry” option should be set to “None”. In this case, this SQL statement will not be executed.
|
|
Implemented in development branch:
|
|
Fixed in:
API documentation updated:
Changes for 5.0:
Changes for 6.0:
Changes for 6.2:
Changes for 6.4:
|
|
Hello rlataria
Latest release fix this issue as well? https://support.zabbix.com/browse/ZBX-21222
Thanks!
|
|
damiancancela, ZBX-21222 looks like a different issue and will be dealt with separately.
|
|
Kalimulin thank you!!!
do you know if someone is working on it?
Thanks!!
|
|
Hi there,
a few days ago we migrated to Zabbix 6.0.20 from Zabbix 5.4 and since then, we have big performance problems.
For Superadmins, everything is smooth. But for everyone else, it is exactly as in https://support.zabbix.com/browse/ZBX-18981
Only that it takes up to 5 or even 10 minutes for the mentioned pages to load.
We monitor ~5.000 hosts and ~4.000 websites with around 380.000 items in about 230 groups.
We have ~270 users in ~60 user groups.
We are using MariaDB 10.11 (with partitions).
Do we need to update to a newer version? Or anythin else we can do?
|
Generated at Wed Sep 03 22:16:31 EEST 2025 using Jira 9.12.4#9120004-sha1:625303b708afdb767e17cb2838290c41888e9ff0.
