|
This is follow up from ZBXNEXT-98.
I have production environment. After upgrade from 2.2.2 to 2.2.3 after some proxies uptime I noticed that their CPU load is increasing and after a week or so it becomes more high than it was before 2.2.3 upgrade.
In general, right after proxy restart its CPU load and other metrics look better than they were on 2.2.2, but after some uptime they become worse, as I just said.
I had a guess that it's related to bulk snmp operations introduced in 2.2.3 and I was right.
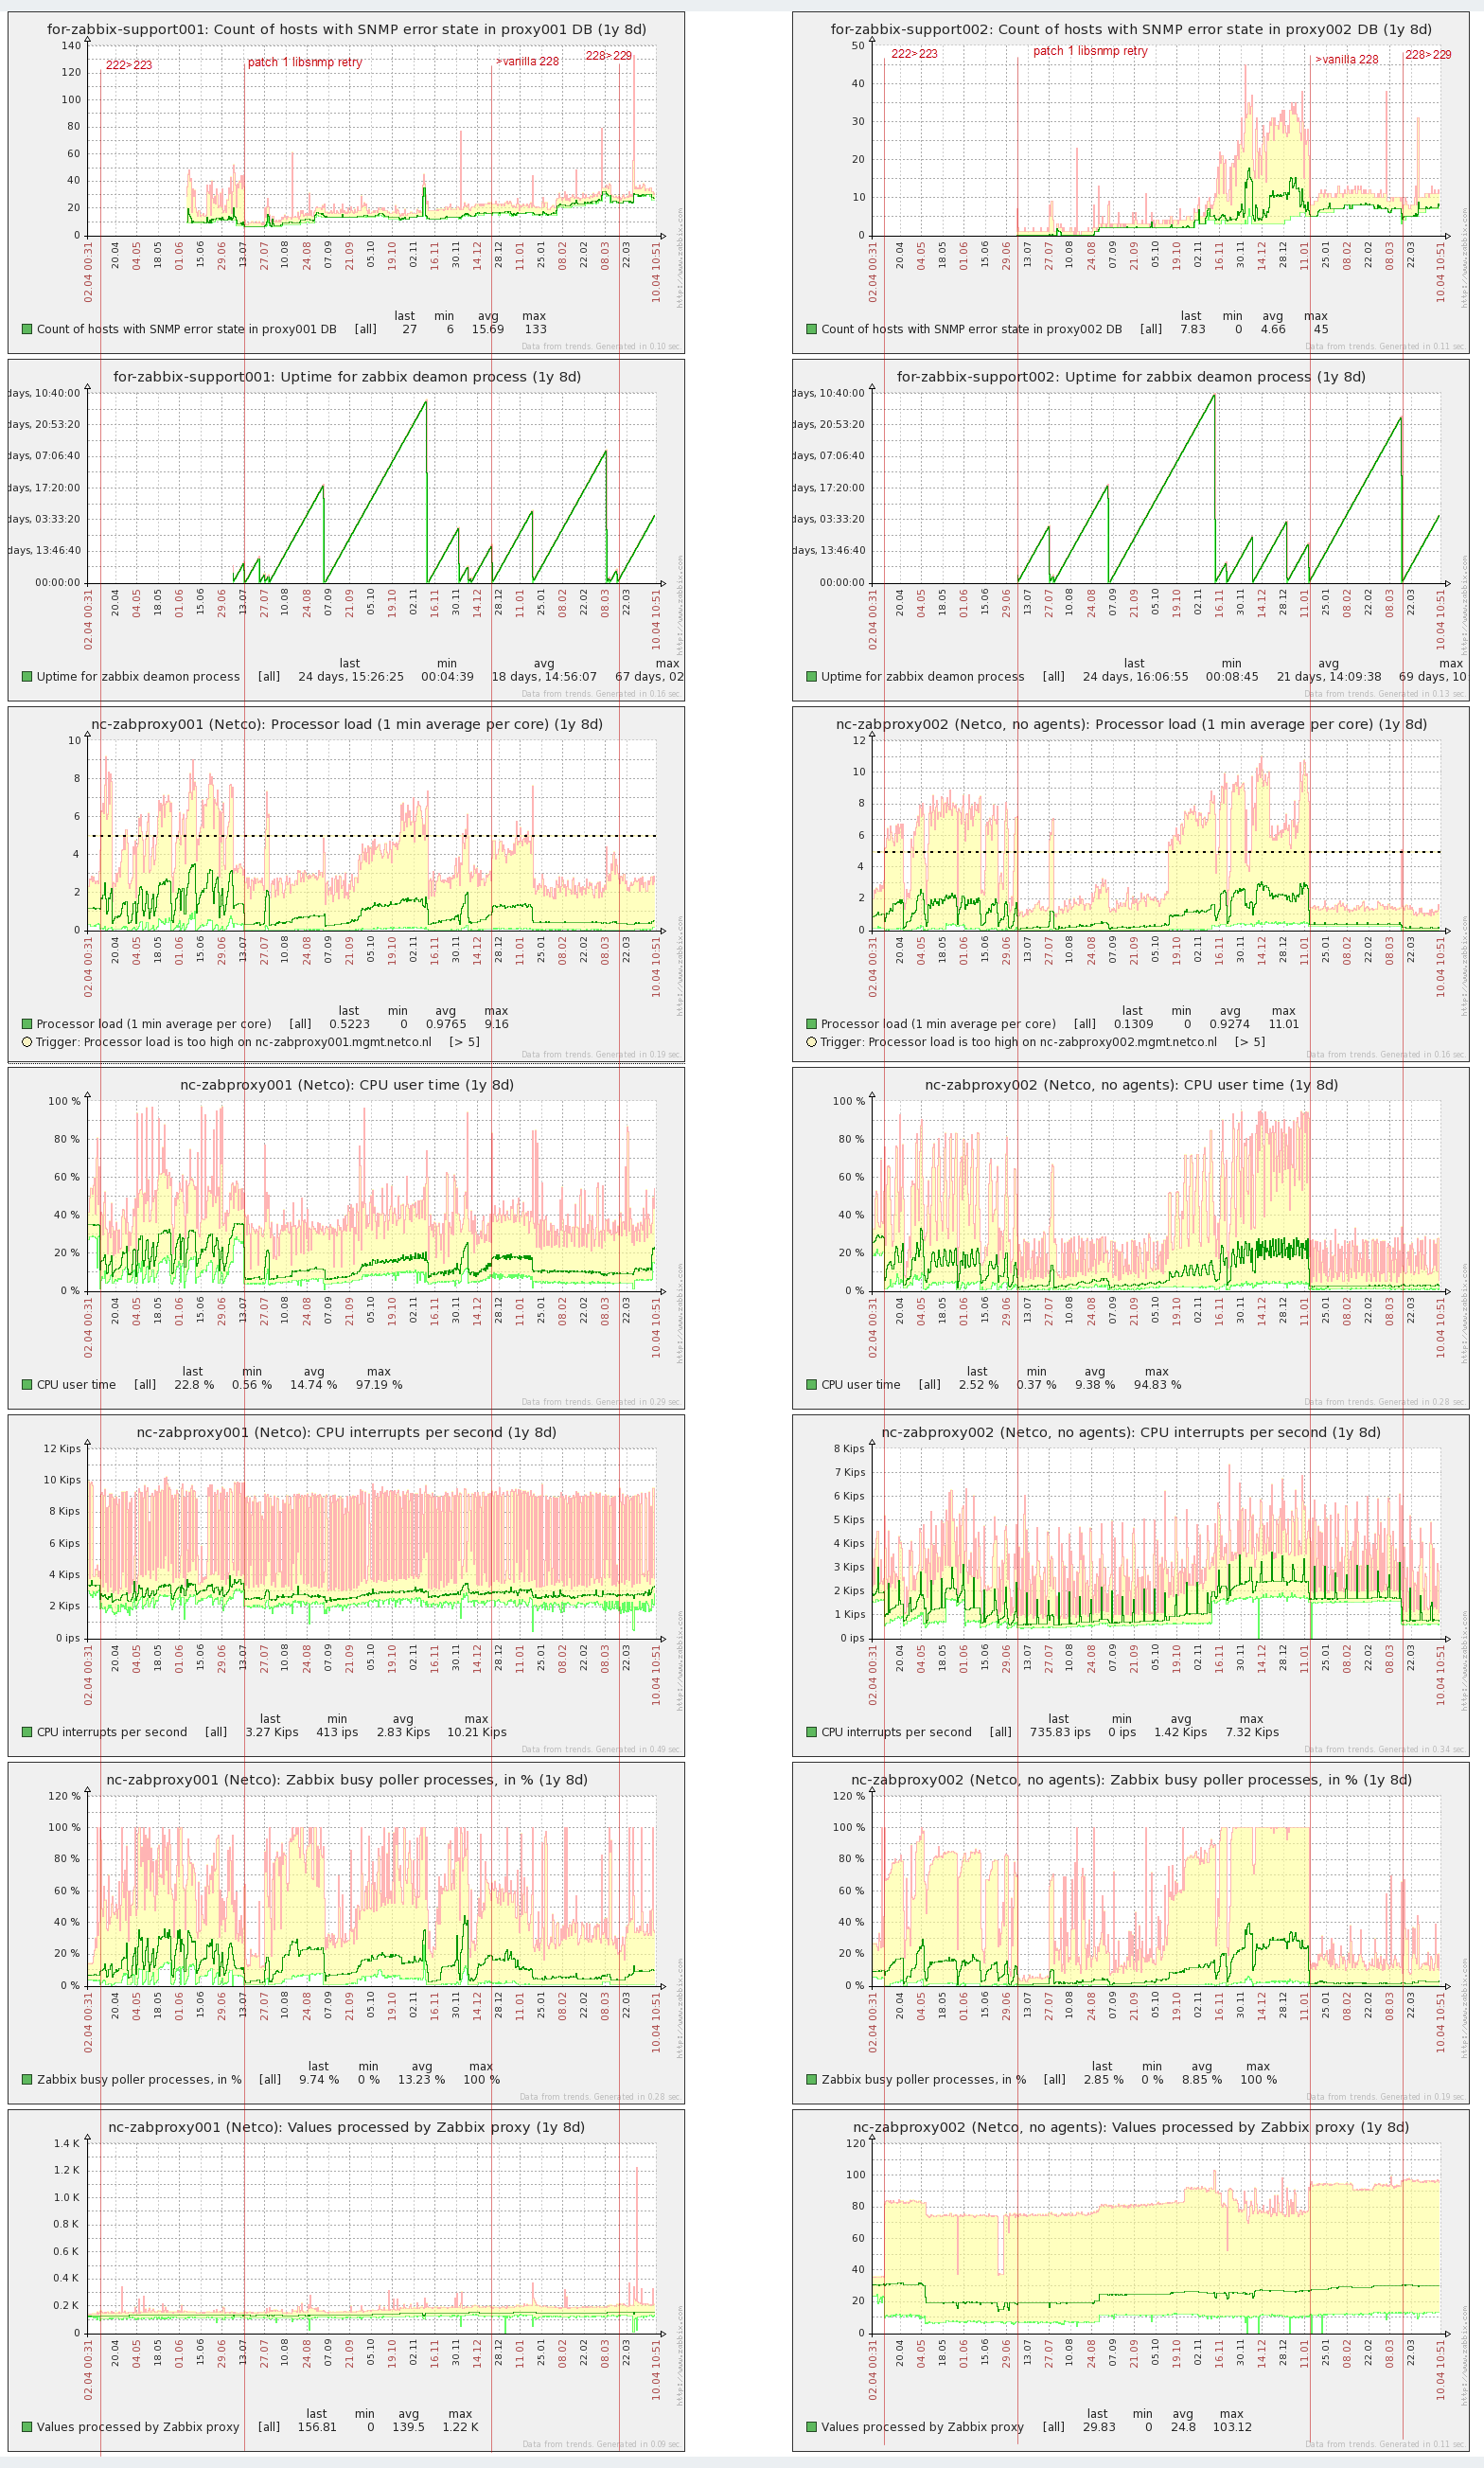
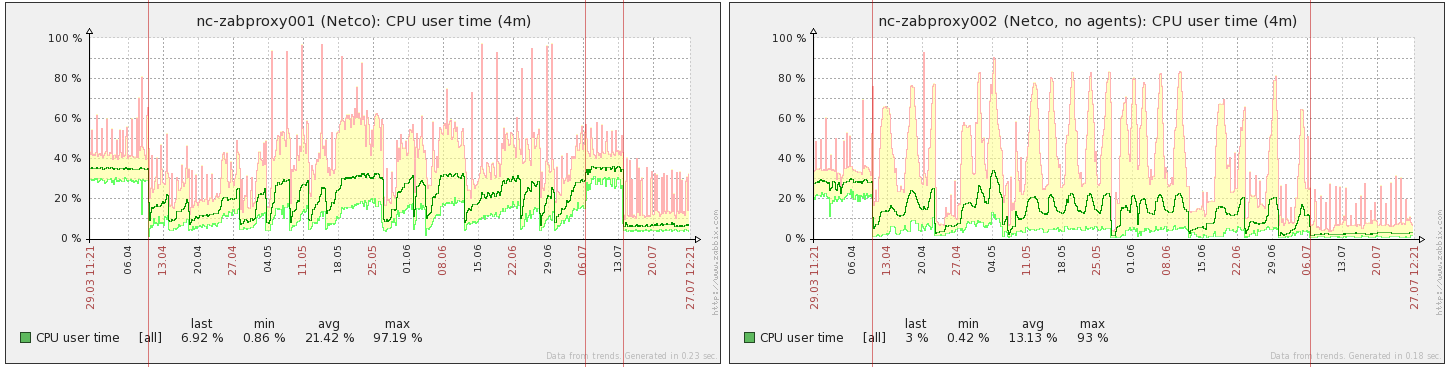
I have two proxies, 1st one (on left side) is doing different checks, including SNMPv3. 2nd one (on right) is doing only SNMPv3 checks.
Below are simple graphs from screen, so selected time period is the same.
I drew several vertical lines with comments to simplify analyzing.
Upgrade to 2.2.3 was done 2014-04-10.
2014-06-07 to both proxies I applied different patches (using 2.2.4 sources). I had to wait one week to make sure that they have any effect.
1st proxy - I applied patch from ZBXNEXT-2301 - to disable bulk snmp operations (pooling distributed by itemID, as before 2.2.3)
2nd proxy - I applied a tiny patch - added one snmp retry for libnetsnmp (check_snmp.c session.retries = 1)
After one week 2014-13-07 on 1st proxy I copied server binary from 2nd proxy, i.e. now 1st proxy is doing bulk snmp with one libnetsnmp's retry.
After that they are running 2 weeks.
Next I'll mention the proxies as 001 and 002.
Analysis:
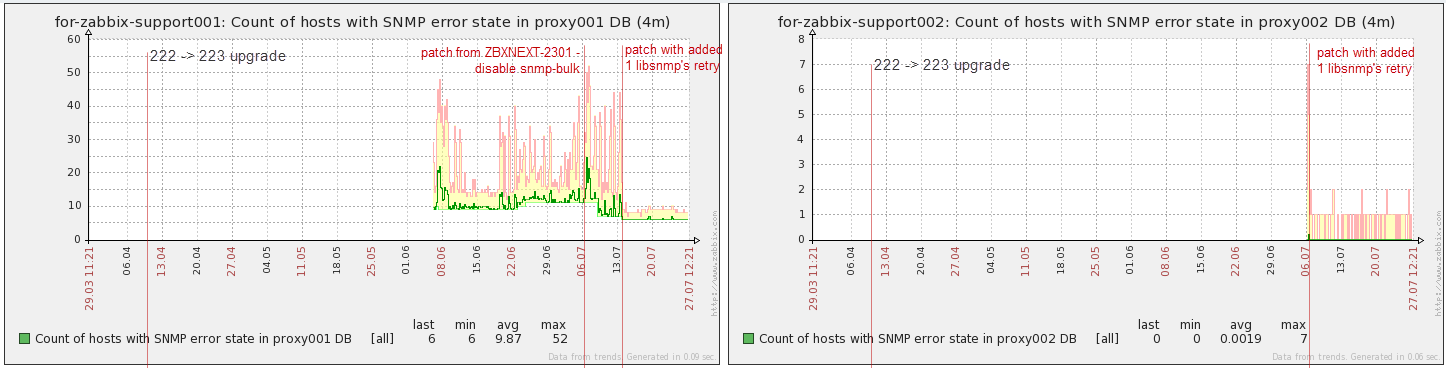
1. This is a user param which collects number of snmp hosts with network error state ("select count from hosts where snmp_errors_from != 0;"). from hosts where snmp_errors_from != 0;").
For 002 I added this user param just before applied patch, but for 001 it was already existing.
Looking to the log files of both proxy (with 1 week uptime) I can see that with one snmp retry the logs are much cleaned of "first network errors".
Graph on 001 shows that with snmp retry number of snmp hosts with network errors is much more stable.
Yes, this is topic for another discussion - reported as ZBX-8538.
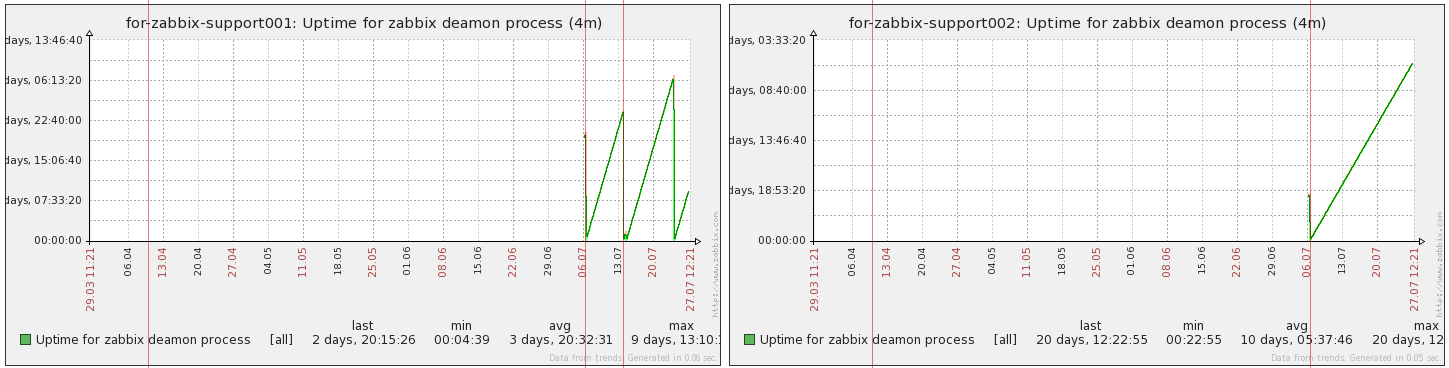
This is just points when proxies were restarted.
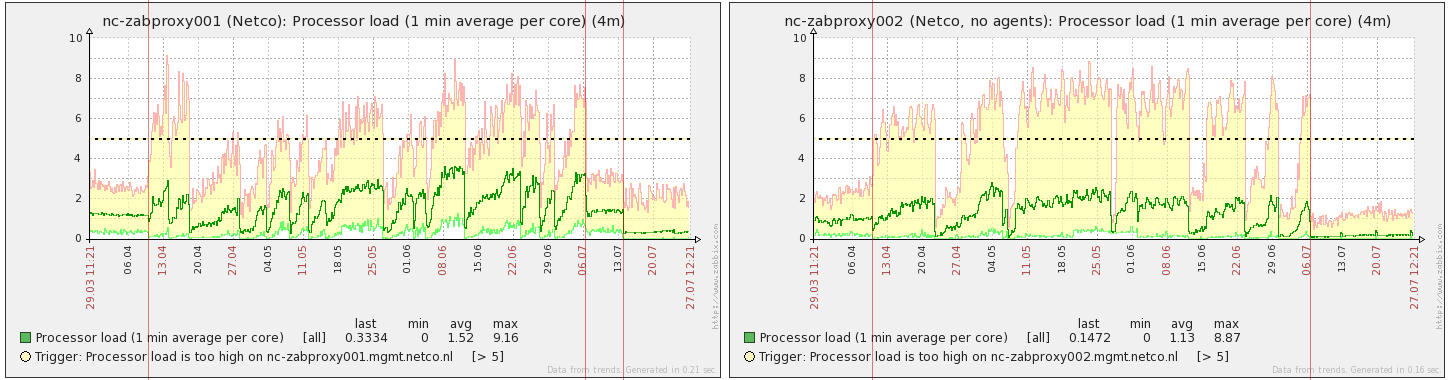
This is interesting. We see that after some uptime CPU load i increasing. When it drops - zabbix proxy deamon was restarted.
On 001 we see that right after restart CPU load is stable at ~1,2 before 2.2.3 and during ZBXNEXT-2301 applied.
For both 001 and 002 wee see that single snmp retry did very positive effect and CPU load doesn't increase so fast as before.
We see that with bulk snmp (when it is indeed bulk) the CPU load is noticeably less.
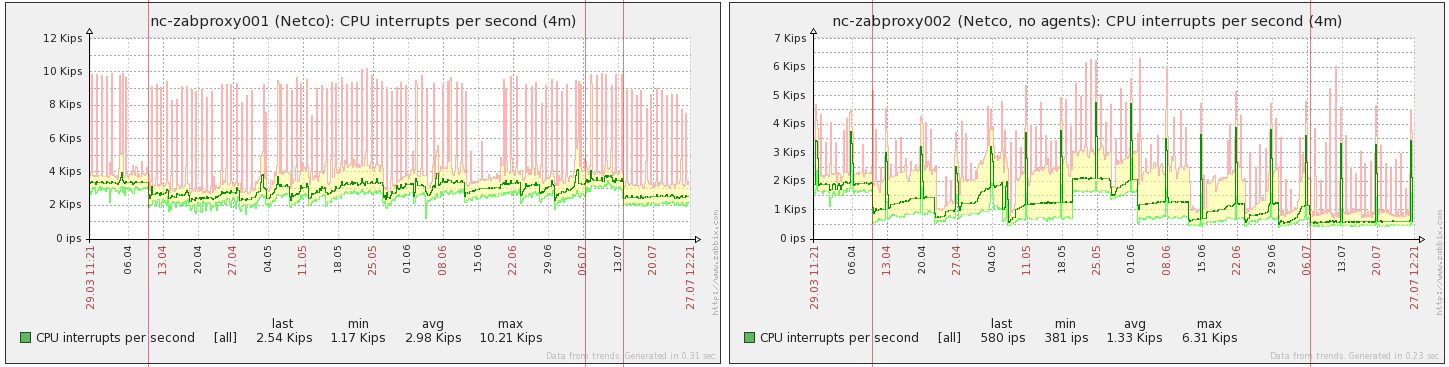
CPU utilization is a bit different from CPU load.
Both proxies have 4 CPU cores.
Utilization is newer worse that it was before 2.2.3. Even after some uptime (when many (all?) snmp devices are polled by single OID grouped by inerfaceID) the utilization becomes ~ as before 2.2.3 upgrade.
This correlates to CPU load above - especially on 002 wee see 2 times less CPU interrupts with snmp bulk.
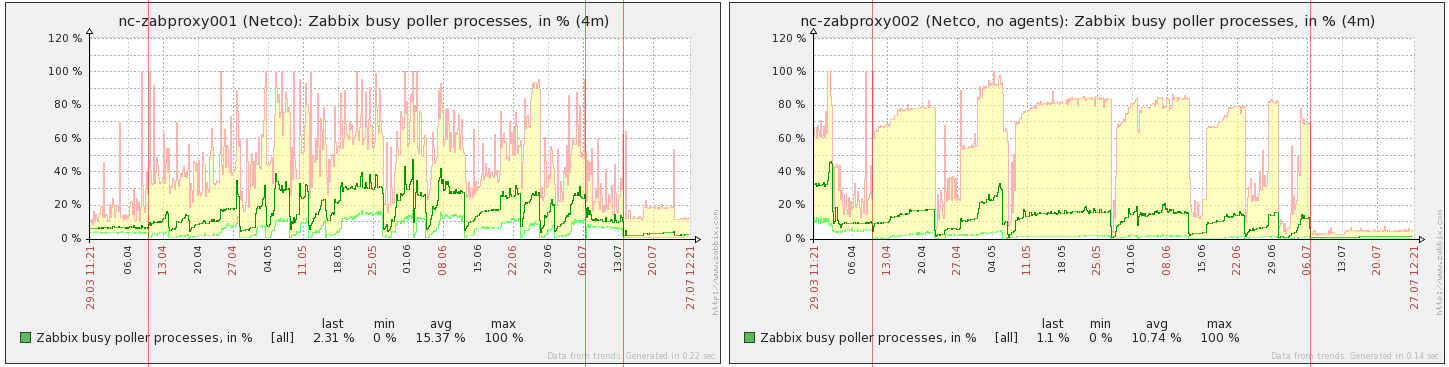
Pollers load are correlated with CPU load:
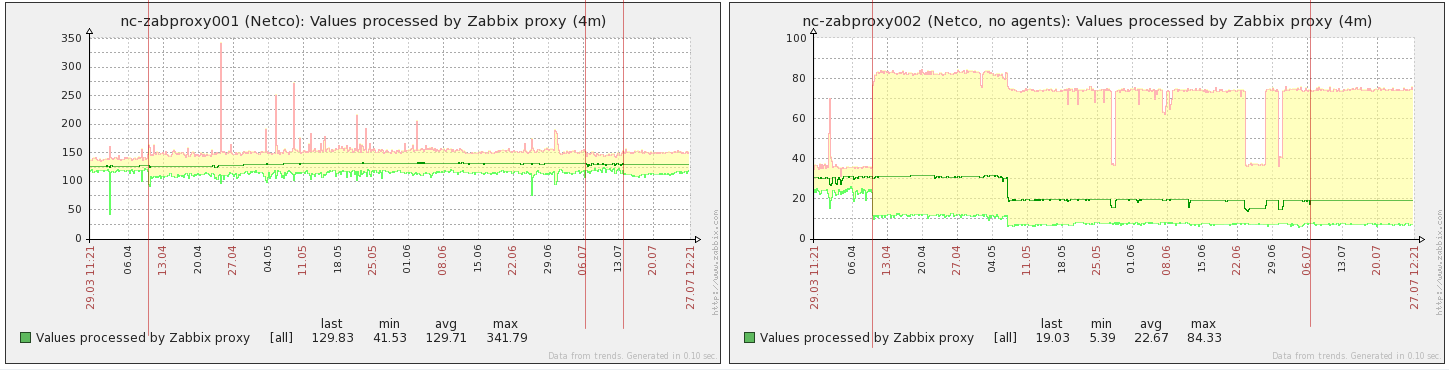
NVPS just in case.
Just note on 002 how difference with max min values (trends) became wide - this is ok - cause by items pooling according to interfaceID. Many items have 5 minutes update interval.
All this graphs on one picture you can find in attachments as "0.all_on_screen.png"
Consequences and suggestions are in next comment.
|
|
Why this happens:
According to logic described on https://www.zabbix.com/documentation/2.2/manual/config/items/itemtypes/snmp#internal_workings_of_bulk_processing when snmp get request is failed during "discovering maximal supported objects" it halves numbers of objects and then increase it by 1 until reaches min_fail-1 again.
But it's also true when zabbix discovered maximal number of supported objects, i.e. it also happens in production if we for example randomly lost UDP packets.
For example I have 10 items on an interface (monitoring localhost snmpd), then I:
started zabbix,
convinced that 10 objects in single request is reached,
stopped snmpd,
in wireshark I see first snmp-get with 10 objects w/o response (actually with ICMP Destination unreachable report),
after zabbix timeout I started snmpd again,
after 3 seconds (timeout -> retries performed by zabbix) zabbix retries with 5 objects in request,
next poll(s) time zabbix will request 9 objects in one get request and 1 objects in additional request.
As we can see every time because of single lost UDP packets (similarly to my experiment) zabbix will use less and less number of objects until it reaches 1 object per get request and it will stay this state until daemon restart.
|
|
(1) documentation
I suggest to change:
For example, assuming the largest response size is 32 variables, the subsequent requests will be of sizes 29, 30, 31, 32, and 33. The last request will fail and Zabbix will never issue a request of size 33 again.
to:
For example, assuming the largest response size is 32 variables, the subsequent requests would be of sizes 29, 30, 31, 32, and 33. The last request would fail so Zabbix will never issue a request of size 33.
Such text is a bit precise for me 
|
|
I have spent the last several working days thinking about the approach we could take on this issue and would now like to share the considerations I have in mind. Some of them seem to be along the lines of what zalex_ua is proposing. If you have any other ideas or elaborations on the general idea below, please share.
So, when we send a request and get timeout, we need to distinguish between 3 cases:
- device was not able to cope with the answer;
- device is down;
- either request or response was lost.
The current approach described at https://www.zabbix.com/documentation/2.2/manual/config/items/itemtypes/snmp#internal_workings_of_bulk_processing deals with cases #1 and #2, and it seems successful at that, but it has so far disregarded case #3. Introducing retries, as suggested in ZBX-8538, seems to be the correct solution, but how exactly should we retry - that is the main question, because retrying mechanism is not only available in Net-SNMP, it is also built into our SNMP bulk implementation, when we halve the number of OIDs and then go one by one, if necessary.
One of the ideas that I had is to divide the workings of bulk processing in two phases: before the optimal number of OIDs is discovered and after. During the first phase, when we do not yet know the characteristics of the device, we can use a large number of Net-SNMP retries (say, 4). This will make (almost) sure that if we get a timeout during this phase, this is not due to case #3. However, once the optimal number of OIDs has been discovered, we can lower the number of Net-SNMP retries (say, 1, or even make it 0), because we also do the retrying ourselves, and if we get a timeout now, it shall not affect the optimal number of OIDs (assuming characteristics of the device do not change).
So, in short, two phases of bulk processing are proposed: one before the number of OIDs has stabilized and after. During the first phase, large Net-SNMP retry setting. During the second phase, small Net-SNMP retry setting.
However, it is a bit more difficult than that. In the internal workings of bulk processing, we limit the size of the request by the number of OIDs in it. However, the actual limit on the size of the response that a device can provide is device-specific and is (most probably) not measurable in the number of OIDs - the size of the UDP packet, perhaps. We do not know the exact reason why a device cannot handle large requests, but we estimate that using the number of OIDs.
A practical manifestation of the above is that there is a certain M number of OIDs up to which a device can always handle the general kind of requests. There is also a certain N, starting from which the device can never handle the general kind of requests. However, there is also some small range between M and N where the device can either answer or not. For instance, a device can always answer requests of 48 OIDs, can answer requests of 49 to 50 OIDs with a varying degree of success, and can never answer requests with 51 OIDs.
The approach that we take should be able to arrive at 48 OIDs in the example above, to reduce timeouts.
There are other open questions, too:
- If a device does not have bulk processing enabled (
ZBXNEXT-2301), we should use some Net-SNMP retry (as suggested in ZBX-8538), because no retrying is done on our side.
- If we use Net-SNMP retries, then what should be the timeout for an operation? Currently, "Timeout" parameter is used with retries of 0. If we set retries to 4 (as proposed for the first phase), then with Timeout=30 it can take as long as 2.5 minutes to discover that a device is unreachable. Also, neogan says that SNMP devices usually answer quickly (within 1 or 2 seconds) or not answer at all.
- According to tcpdump in
ZBX-8610, the percentage of lost packets can be quite big (around 10%), so Net-SNMP retry of 1 (as suggested in ZBX-8538) might be too small.
- We should sometimes rediscover the optimal number of OIDs, because the characteristics of the device can change.
|