|
This would be very useful for one more purpose - grouping packet loss and RTT on the same graph.
|
|
I started to code this based on the 1.8.11 code base.
I have attached my php frondend code (zabbix-frontend-axis.patch), as well as an MySQL update (zabbix-frontend-axis-mysql-update.txt) to alter the graphs table so that my code can work.
Please just take note that I haven't touched any of the C code, which would mean that the Zabbix API calls won't be able to alter the right axis values yet.
I do hope that I've correctly modified the frontend code. I have applied it to our production Zabbix system and everything (creating graphs, modifying graphs, viewing graphs and exporting hosts) seemed OK.
Please let me know if I made mistakes or if I should provide C code fixes too.
|
|
what about importing ? 
does import and export both correctly handle new values ?
as for c code, api is fully in php, but on the server side this might be needed in the network discovery/active agent auto-registration code - otherwise these features would not work properly.
of course, you don't have to do the c part, unless you are interested in those features
|
|
richlv:
I just exported and imported a host and the graph limits was successfully imported, so it seems like the importing is using the export class too.
I haven't tried importing/exporting between patched & unpatched versions though, but since it is XML, I suppose they'll just ignore the new values and use default values.
|
|
Hi guys.
Is it going to be deployed to any version of Zabbix ? 2.0.4 maybe ?
Marcus
|
|
That needs a database schema change and can therefore only go in 2.2 or a later major release. Also notice the tag "NMR" above, refering to that.
|
|
Thanks,
Hoping for 2.2, at least.
If I implement the proposed scripts, would it break anything (as far as you know, of cource) ?
I don't know what NMR means...
Thanks a lot.
Marcus
|
|
"need major release" or something like that
as for this feature, it's not planned currently (there's enough of other, financed features coming, though - some of them listed at https://www.zabbix.org/wiki/Docs/roadmap#Functional_roadmap )
|
|
Thanks a lot for the info.
Marcus
|
|
Marcus:
My change for adding the 2nd axis' configuration in Zabbix 1.8 was rather simple, but it took a couple of hours to implement it. I only appended columns to the existing database scheme. I only modified the web frontend code & schema with my patch.
You can probably look at my code when you want to do something similar to 2.0.4 
Unfortunately I won't be making a patch for 2.0.4 soon, because the change over for my company from 1.8 to 2.0 would be too much effort since I've modified our 1.8 web frontend quite a bit!
|
|
Thanks a lot Chris.
Marcus
|
|
If I may, still in this subject... Maybe someone already told you that. Maybe a I have to create a new ticket.
If you guys are really going to make this option available. In the graph itself, I think it would be essential to the scales inherit the data/line's colors. (Or, at least, it should have a label showing whose data is that).
Marcus
|
|
that's an unrelated issue - ZBXNEXT-932
|
|
Just ran into the need for this as well.
I need to plot a state (integer ranging from 0 to 6) and a time measurement ranging from 0 ms to 5 seconds) on the same graph.
I'd really like to have a fixed scale for the state info, while the time measurement scale should be calculated.
|
|
-''- ... Graphing item values on the left and utilization in percentage on the right - need to auto-scale the other and fix the percentage scale to 0-100.
|
|
Just the same problem.
Example:
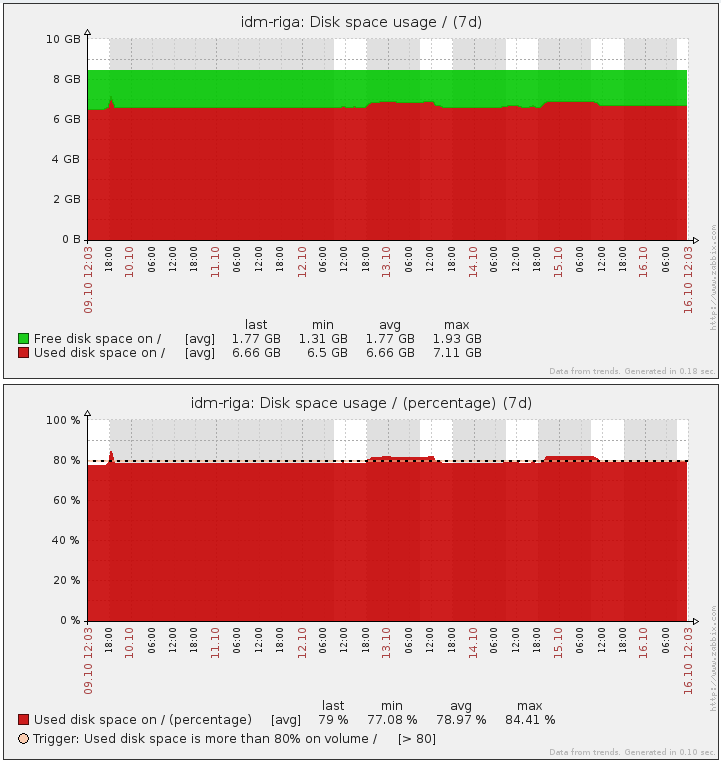
We monitor a disk space for some system, threshold in trigger is set as a percentage.
I'd like to have a graph for a disk space usage: in gigabytes and in percents, as well as a trigger threshold.
In theory, it is possible to use a single graph with two Y-axis (for gigabytes and for percents). However, really it is impossible due to different scales for these axis, so that datas are not matching.
It is possible to have 2 different graphs (see picture). However, the first graph has no percentage and threshold line, but the second one has no real numbers in gigabytes.
Just now it is impossible to set the scale for each Y-axe separately, this setting affects both axis simultaneously. But they have too different scale (otherwise there is no sense to use two Y-axis).
|
|
Hello
Is there any timeline when this improvement will be done; it is a great feature!
Kind regards
Daniel
|
|
I need the same, fixed on right Y axis, calculated on the left Y axis
|
|
Another +1 here
This is absolutely necessary to combine anything dynamic (like bytes of free disk space) with a percentage. If you have bytes on the left and percentage on the right, then you would want a calcaluted scale on the bytes and a fixed 0-100 range on the percentage.
|
|
New dashboard graphs already provide this functionality. It will be extended to all graphs as soon as we move fully to vector graphics, most likely in 4.4.
|
|
Zabbix 5.0 user here - am I missing something or has this still not been implemented?
I would also highly benefit from this feature! I'm monitoring a temperature sensor in our server room and I have temperature on the right, humidity on the left and if I set fixed values to 0-100 then you can barely tell the temperature.
I'd need 18-28 for temp and 20-60 for humidity...
|
|
not_working_here, it has been implemented for dashboard graphs. We are still working on merging functionality of older graphs with new graph engine.
|
|
Yes, I saw that, the dashboard graphs are great but I'd like to build a screen with those graphs. And since you wrote "It will be extended to all graphs as soon as we move fully to vector graphics, most likely in 4.4." I wanted to ask whether I had simply missed an option since I'm already using 5.
|
|
The new Graph widget we have since Zabbix 6.0 supports fixed min/max values for the left and right axis. I am closing this ticket.
|
Generated at Wed Jul 16 10:24:54 EEST 2025 using Jira 9.12.4#9120004-sha1:625303b708afdb767e17cb2838290c41888e9ff0.