|
Attachments:
|
 number_rounding.png
(152).png
number_rounding.png
(152).png
 (152).txt
4588_sbox.PNG
Screenshot_6.png
Selection_040.png
Selection_041.png
big-error-width.png
comboboxes-after.png
comboboxes-before.png
content_width_error.gif
crispEdges.png
data-points-hover.png
date_on_graph.png
date_space.png
disabled_item.png
displaying20of50.png
edge_undefined.png
empty-hintbox.png
ff_tooltip.gif
fill.png
fill_ordering_not_responding.png
graph_granulation_1.png
graph_granulation_2.png
graph_jumps.gif
grey-clock-icon.png
hc-theme-overrides.png
headroom.png
hint-with-no-value.png
hintbox-size.png
hintbox_debug.png
hover.gif
hover.gif
hover2.gif
incorrect-footnote-in-tooltip.png
incorrect-left-axis-value.png
line_ff.gif
max-left-axis-value.png
min-left-axis-value.png
minmax.png
misalign.png
missing-v-axes.png
missing_value.png
no_space_for_date.png
noaxes_nodata.png
nodata.png
numbers_too_close.png
one_value_with_footer.png
outside_graph.png
points_0.9.png
problem_5_min.png
problem_line.png
problem_red_line.gif
revers-fill.png
sBox-hiding.png
sad_graphs.png
sbox_selection.gif
second_graph_color.gif
short_legend.png
strange-endings-of-the-graph-curve-1.png
strange-endings-of-the-graph-curve-2.png
strange-endings-of-the-graph-curve.png
suffixed-agent-ping.png
time-override-icon.png
time-period-tab.png
tooltip_scroll.gif
transparency_loss.png
trapp_last_6_hours.gif
trapper_values.png
treat_as_0_y_axis.png
treataszerostaircase.png
trends.png
two_points.png
value_null.png
widget-header-icons.png
with_crispEdges.png
without_crispEdges.png
y-axis-missung-values.png
y-axis_and_line.png
y-axis_right.png
y-labels-111.png
y_axis.png
zero_on_y.png
zoom.gif
(152).txt
4588_sbox.PNG
Screenshot_6.png
Selection_040.png
Selection_041.png
big-error-width.png
comboboxes-after.png
comboboxes-before.png
content_width_error.gif
crispEdges.png
data-points-hover.png
date_on_graph.png
date_space.png
disabled_item.png
displaying20of50.png
edge_undefined.png
empty-hintbox.png
ff_tooltip.gif
fill.png
fill_ordering_not_responding.png
graph_granulation_1.png
graph_granulation_2.png
graph_jumps.gif
grey-clock-icon.png
hc-theme-overrides.png
headroom.png
hint-with-no-value.png
hintbox-size.png
hintbox_debug.png
hover.gif
hover.gif
hover2.gif
incorrect-footnote-in-tooltip.png
incorrect-left-axis-value.png
line_ff.gif
max-left-axis-value.png
min-left-axis-value.png
minmax.png
misalign.png
missing-v-axes.png
missing_value.png
no_space_for_date.png
noaxes_nodata.png
nodata.png
numbers_too_close.png
one_value_with_footer.png
outside_graph.png
points_0.9.png
problem_5_min.png
problem_line.png
problem_red_line.gif
revers-fill.png
sBox-hiding.png
sad_graphs.png
sbox_selection.gif
second_graph_color.gif
short_legend.png
strange-endings-of-the-graph-curve-1.png
strange-endings-of-the-graph-curve-2.png
strange-endings-of-the-graph-curve.png
suffixed-agent-ping.png
time-override-icon.png
time-period-tab.png
tooltip_scroll.gif
transparency_loss.png
trapp_last_6_hours.gif
trapper_values.png
treat_as_0_y_axis.png
treataszerostaircase.png
trends.png
two_points.png
value_null.png
widget-header-icons.png
with_crispEdges.png
without_crispEdges.png
y-axis-missung-values.png
y-axis_and_line.png
y-axis_right.png
y-labels-111.png
y_axis.png
zero_on_y.png
zoom.gif
|
|
Issue Links:
|
Causes
|
|
causes
|
ZBXNEXT-4772
|
New graph widget zoom requires full p...
|
Open
|
|
causes
|
ZBXNEXT-4770
|
New graph widget is not resized with ...
|
Open
|
|
causes
|
ZBXNEXT-4775
|
No permissions to data on graph widge...
|
Open
|
|
causes
|
ZBXNEXT-4874
|
Long unit names must be shortened on ...
|
Reopened
|
|
causes
|
ZBXNEXT-4769
|
New Graph Widget usability improvements
|
Closed
|
|
causes
|
ZBXNEXT-4872
|
Rework SVG graph widget timeline
|
Closed
|
|
causes
|
ZBXNEXT-4873
|
Graph data set must be changed to 'po...
|
Closed
|
|
causes
|
ZBX-15202
|
SVG graph widget refresh must be paus...
|
Closed
|
Duplicate
|
|
is duplicated by
|
ZBX-14844
|
Misleading message while creating the...
|
Closed
|
Sub-task
|
|
depends on
|
ZBXNEXT-1151
|
Show values on mouse-over in graphs
|
Open
|
|
depends on
|
ZBXNEXT-4626
|
Layout for widget configuration
|
Closed
|
|
depends on
|
ZBXNEXT-245
|
Provide Left and Right Axis Fixed Val...
|
Closed
|
|
part of
|
ZBXNEXT-271
|
In graphs, make 'stacked' type for in...
|
Open
|
|
part of
|
ZBXNEXT-562
|
Get PNG graph image via API
|
Open
|
|
part of
|
ZBXNEXT-117
|
Add comments to graphs
|
Open
|
|
part of
|
ZBXNEXT-599
|
Logarithmic scale for Y-axis in graphs
|
Closed
|
|
part of
|
ZBXNEXT-943
|
Positive and negative y-axis graphing...
|
Closed
|
|
| Sub-Tasks: |
|
| Team: |
 Team B Team B |
| Sprint: |
Sprint 35, Sprint 36, Sprint 37, Sprint 38, Sprint 39, Sprint 40, Sprint 41, Sprint 42, Sprint 43, Sprint 44, Sprint 45, Sprint 46, Nov 2018, Sprint 47, Dec 2018, Sprint 48, Jan 2019 |
| Story Points: |
14.5
|
|
The core functionality is to create a new type of widget that will be flexible enough for the most use cases required for ad-hoc graphing.
The new widget must support:
- Server-side SVG based graph generation
- Ability to select set of items for graphing using one or more conditions:
- Host and item name
- Both host and item name will support character '*' for pattern matching
- Ability to overwrite graphing options for a set of items selected using one or more conditions:
- Host and item name
- Both host and item name will support character '*' for pattern matching
- Each data set will support the following options
- Draw type: Lines, Points, Staircase
- Additional optional attributes for different draw types:
- Filled (0-10, 5 (30%) is default): fill it, available for Lines
- Radius (3 is default): available for Points.
- Color: selection of color
- Width (0-10, 1 is default): line width
- Transparency (0-10, 5 (50%) is default): transparency level.
- Y axis: Left (default), Right
- Time shift: none (default) or using format like -1h, 1h, -1d, -1m, etc.
- Time period: none (default) or override using Time from and Time to.
- Options to support missing data. Gaps will be calculated as lack of data exceeding three times average distance between time stamps (the algorithm may be adjusted later on).
- None: leave gap empty
- Connected: connect two border values
- Treat as 0: display as 0 values
- The widget will support the following options:
- Legend can be displayed in two modes:
- None: no legend is displayed
- Short (default): short legend is displayed under graph
- Ability to select set of problems for displaying as highlighted area using one or more conditions:
- None: no problems displayed
- Selected metrics (default), by host, by severity, by trigger tags (including choice of AND/OR), by problem name.
- Optional attributes for left and right Y axis, per axis:
- Min and max values: calculated (default), fixed value
- Display axis: show (default), hide
- Optional attributes for X axis:
- Display axis: show (default), hide
- A tooltip will be display additional information on mouse over:
- Displayed data point: all values for current X coordinate
- Problem area: details of all for the point on area
- Selection of history data:
- Auto (default): automatically as implemented currently
- History: all data is taken from history
- Trends: all data is taken from trends
- Options to display left and right Y axis units, per axis
- Auto: values will be displayed using units of the first item
- Static: overwrite units with given string
Support of macros $1-$9 in item names must be removed in order to make pattern matching work.
The widget configuration form must be optimized for making one-click modifications without forcing users to use hierarchical controls, if possible. That is why, for example, Lines and Staircase made as separate drawing types.
|
|
My input:
- Y axis: if display graph data scale is selected left and right, it would be a good thing to add a visual identifier which points to the related scale (to prevent that the user has to guess by analyzing the min/max/avg values in the legend)
- Y axis: it should be possible to use different graph types if left and right is selected
- Y axis min/max value: also should be possible to use a base value (often 0, if you use negative/positive values)
- it should be possible to add a description to a graph which explain details (alternatively show item description with hover effect)
- add a possibility to show the legend on demand
|
|
Dear Team,
I have now tested the new Beta1 of Zabbix 4.0, very good work for the "New Graph Widget" and "Maintenance Tag based" features.
On the new Graphs i have appreciated the versatility of the configuration parameters, very good work but why not extend that "graphs" to "latest data Graphs" and "Screens"?
Also if is possible, i think is a very good idea to provide a Zabbix API to get the rendered graphs and use on custom reporting tools.
What do you think about?
Thanks very much
PS: If is possible, please add a Gauge Graph option 
|
|
Yes, why limit these powerful graphs capabilities to a dashboard widget ? I would be really nice to have this everywhere where defining a graph is possible.
|
|
Extreme performance hit observed on MySQL DB side with widget having "Show problems" selected.
# Time: 2018-08-29T14:26:35.319915+02:00
# User@Host: zbx_web[zbx_web] @ localhost [] Id: 13250
# Schema: zabbix Last_errno: 0 Killed: 0
# Query_time: 18.498415 Lock_time: 0.000138 Rows_sent: 1112946 Rows_examined: 10119294 Rows_affected: 0
# Bytes_sent: 14468420
SET timestamp=1535541995;
SELECT DISTINCT e.eventid,er1.r_eventid FROM events e LEFT JOIN event_recovery er1 ON er1.eventid = e.eventid WHERE e.value = 1 AND e.source = 0 AND e.object = 0 AND NOT e.eventid BETWEEN 2783580 AND 2783605 AND e.eventid NOT IN (2783578,2783607) GROUP BY e.eventid,er1.r_eventid HAVING EXISTS (SELECT NULL FROM events WHERE eventid = er1.r_eventid AND clock >= '1535538376') OR er1.r_eventid IS NULL;
6 items in graph having NO triggers. Percona MySQL 5.7.22.
And PHP Memory limit 512M obviously exhausted too.
Debug stats from a graph which ironically does not show any items at all.
******************** Script profiler ********************
Total time: 24.857787
Total SQL time: 19.038748
SQL count: 27 (selects: 16 | executes: 11)
Peak memory usage: 276.007813M
Memory limit: 512M
|
|
hello, just some remarks i noticed immediately after installing 4.0.0beta1. as we are desperately looking for improved graphs, so i was just looking into them. attached screenshot shows 2 bugs - legend has 2 lines configured, but both graph legends are displayed in the same line. and on mouse over part of the tooltip text is "outside" browser.
|
|
dimitri.bellini, tatapoum, of course, we will add this functionality in other places, but it will be in future versions of the product. In 4.0, we will limit ourselves to developing only this widget.
|
|
Implemented in:
- pre-4.0.0beta1 r84174, r84188
- pre-4.0.0beta2 r84694, r84676
- pre-4.0.0rc1 r85025
|
|
Hi DevTeam,
could you better details the documentation related to the field called "Item Pattern" on Data Set configuration? We could use regular expression to select the Items?
Thanks very much
|
|
dimitri.bellini, I moved your request to ZBXNEXT-4740. This information will be added necessarily. Thank you!
|
|
Fixed in:
|
|
@Alexander: Thanks!
|
|
(148) [D] properties problem_time_from and problem_time_till for API method event.get should be described in public documentation.
Miks.Kronkalns
4.0:
4.2:
RESOLVED
iivs API changes 3.4 to 4.0 are not described.
REOPENED
Miks.Kronkalns Thank you! Here is the link.
RESOLVED
iivs CLOSED
|
|
Hi!
in "classic" graphs you have a little headroom for the lines. Same is applicable for Grafana. However in new graphs, if upper limit is left to be "calculated", there is no such headroom - top part just bumps into the maximum value you have collected (see screenshot attached). Would it not be nice to introduce such headroom also for new graphs? 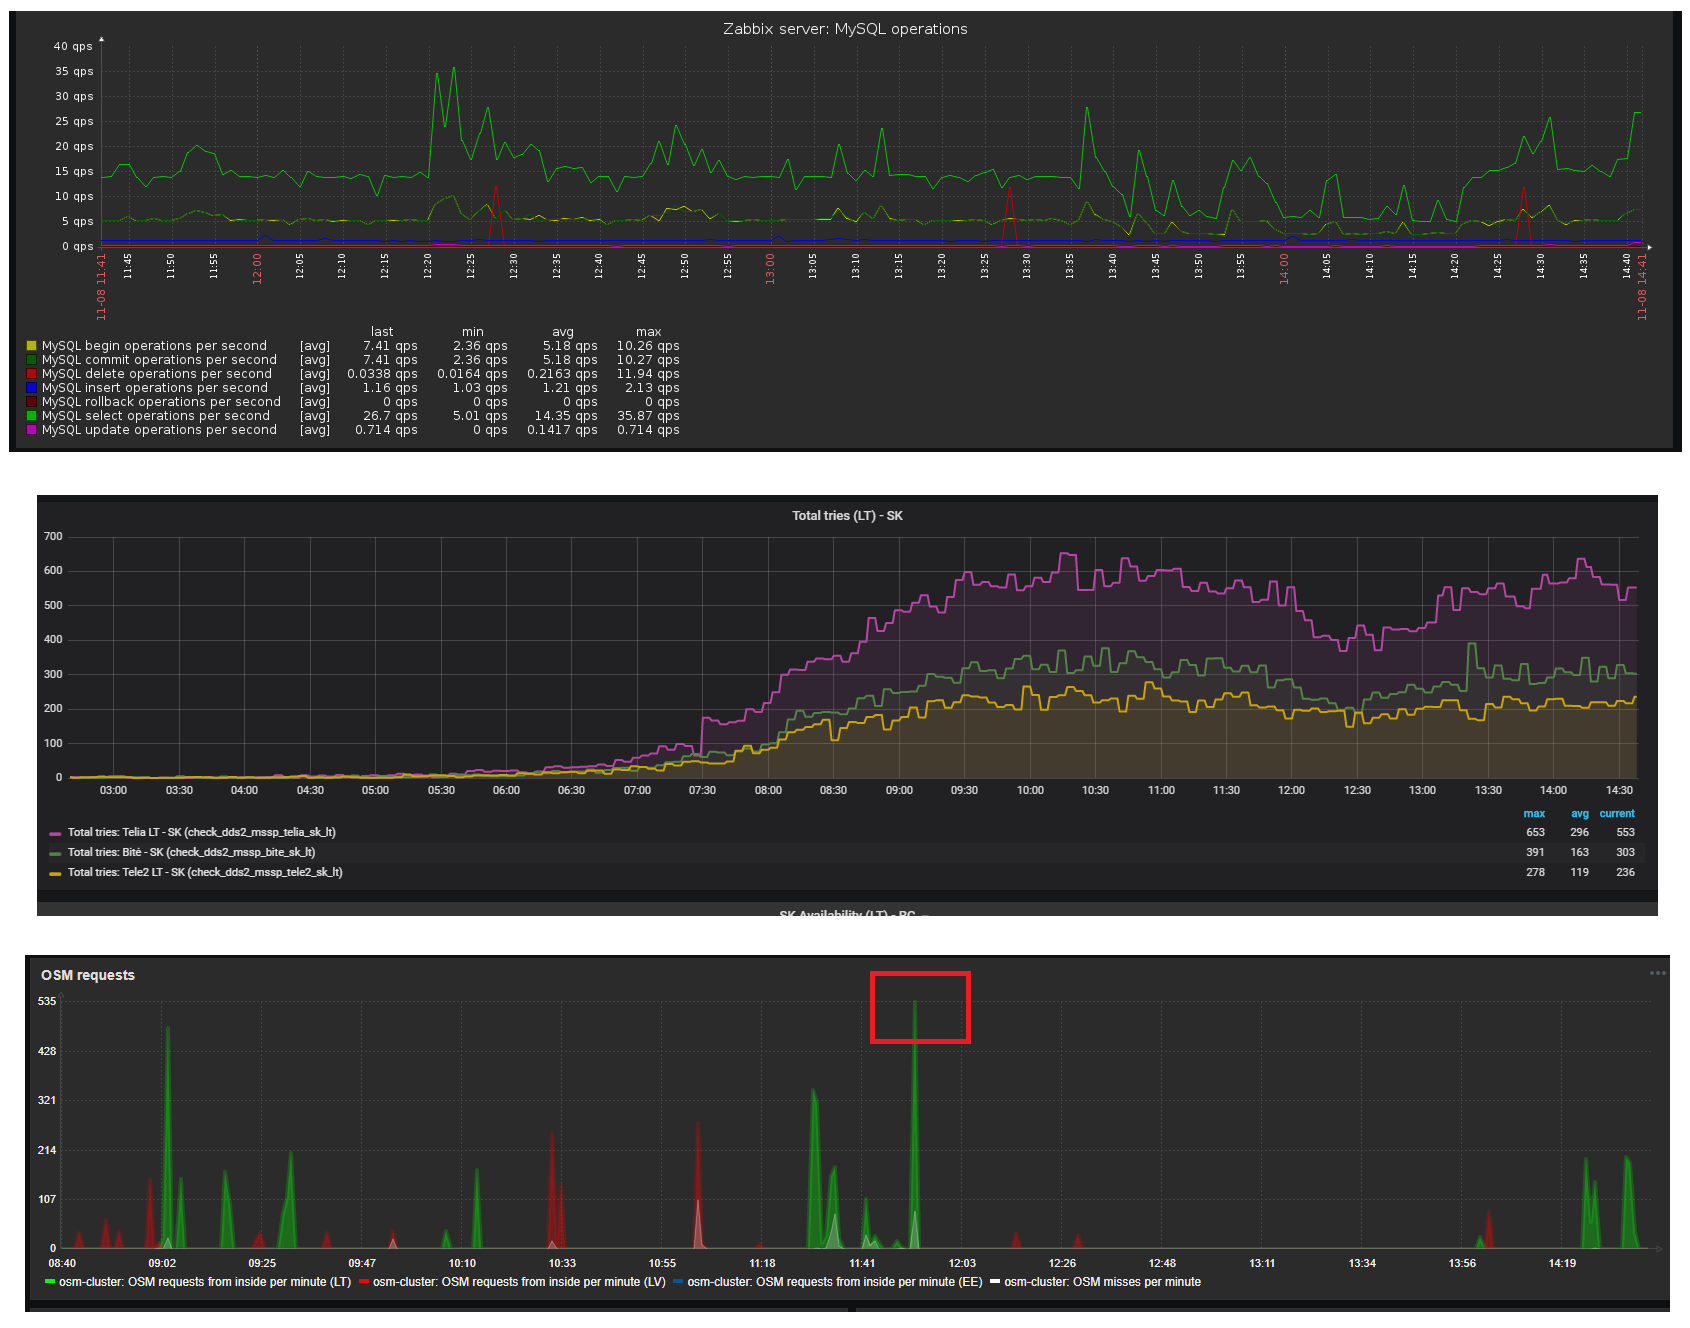
|
|
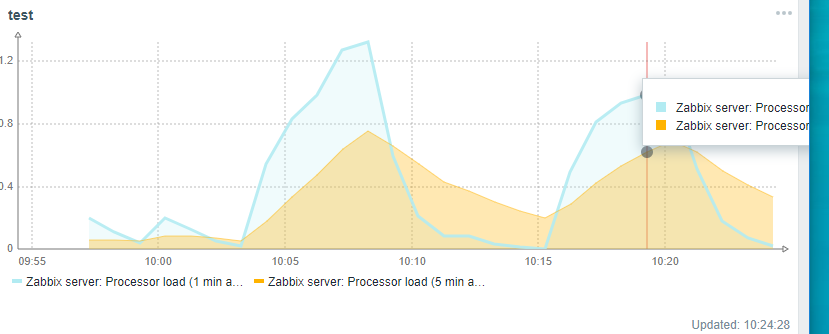
When hovering the graph actual data at that moment is visible on the screen.
How about adding also a timestamp there?
When a large period is observed and just checking actual values it is very hard to understand at what time it was collected.
|
|
@Dmitrijs, I also asked for this in https://support.zabbix.com/browse/ZBXNEXT-4819
|
|
Cool, didn't notice. +1 vote from me
|
|
Multiple issues fixed in:
- 4.0.4rc1 r88075, r88079
- 4.2.0alpha2 (trunk) r88072, r88080.
|
|
The new graph widget does not appear to draw "workingTime".
I need a new graph widget to show "working time" like the previous graph.
|
|
Hello qryuu, thank you for your comment.
That behaviour is expected in current implementation of graph widget. Please use classic graph if showing working days is critical for your data visualisation.
|
|
Looks like new graph widget does not support float precision when specifying minimum Y axis values: ZBX-17329
|
|
It would be good if trigger lines could be displayed in new svg graph widget. looks like its already requested here: ZBXNEXT-4964
|
Generated at Tue Jun 16 05:06:58 EEST 2026 using Jira 10.3.18#10030018-sha1:5642e4ad348b6c2a83ebdba689d04763a2393cab.