|
Sub-task |
[ZBXNEXT-7565] Backtrace what caused SLA to drop Created: 2022 Mar 18 Updated: 2022 Dec 29 |
|
| Status: | Open |
| Project: | ZABBIX FEATURE REQUESTS |
| Component/s: | Frontend (F) |
| Affects Version/s: | 6.0.2 |
| Fix Version/s: | None |
| Type: | Change Request | Priority: | Minor |
| Reporter: | Aigars Kadikis | Assignee: | Unassigned |
| Resolution: | Unresolved | Votes: | 8 |
| Labels: | SLA, sla | ||
| Remaining Estimate: | Not Specified | ||
| Time Spent: | Not Specified | ||
| Original Estimate: | Not Specified | ||
| Attachments: |
|
||||
| Issue Links: |
|
||||
| Description |
|
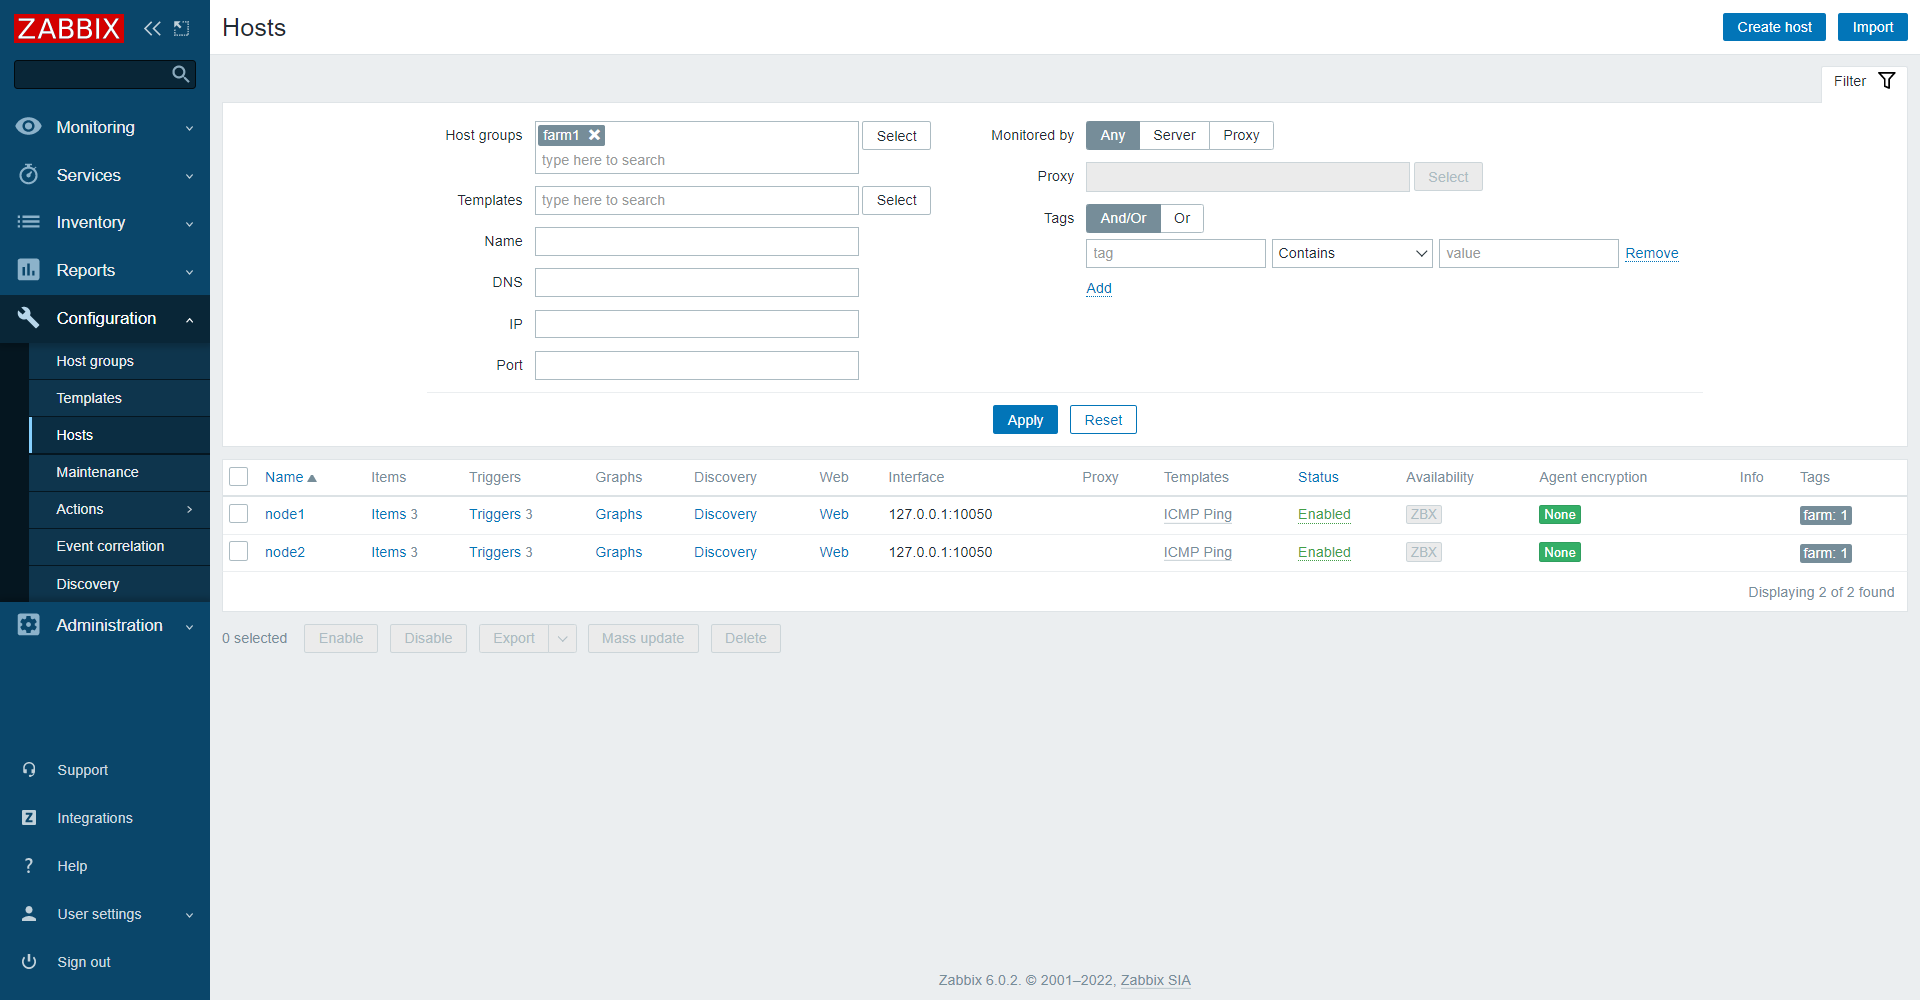
In farm we have 2 or more servers: node1 and node2.
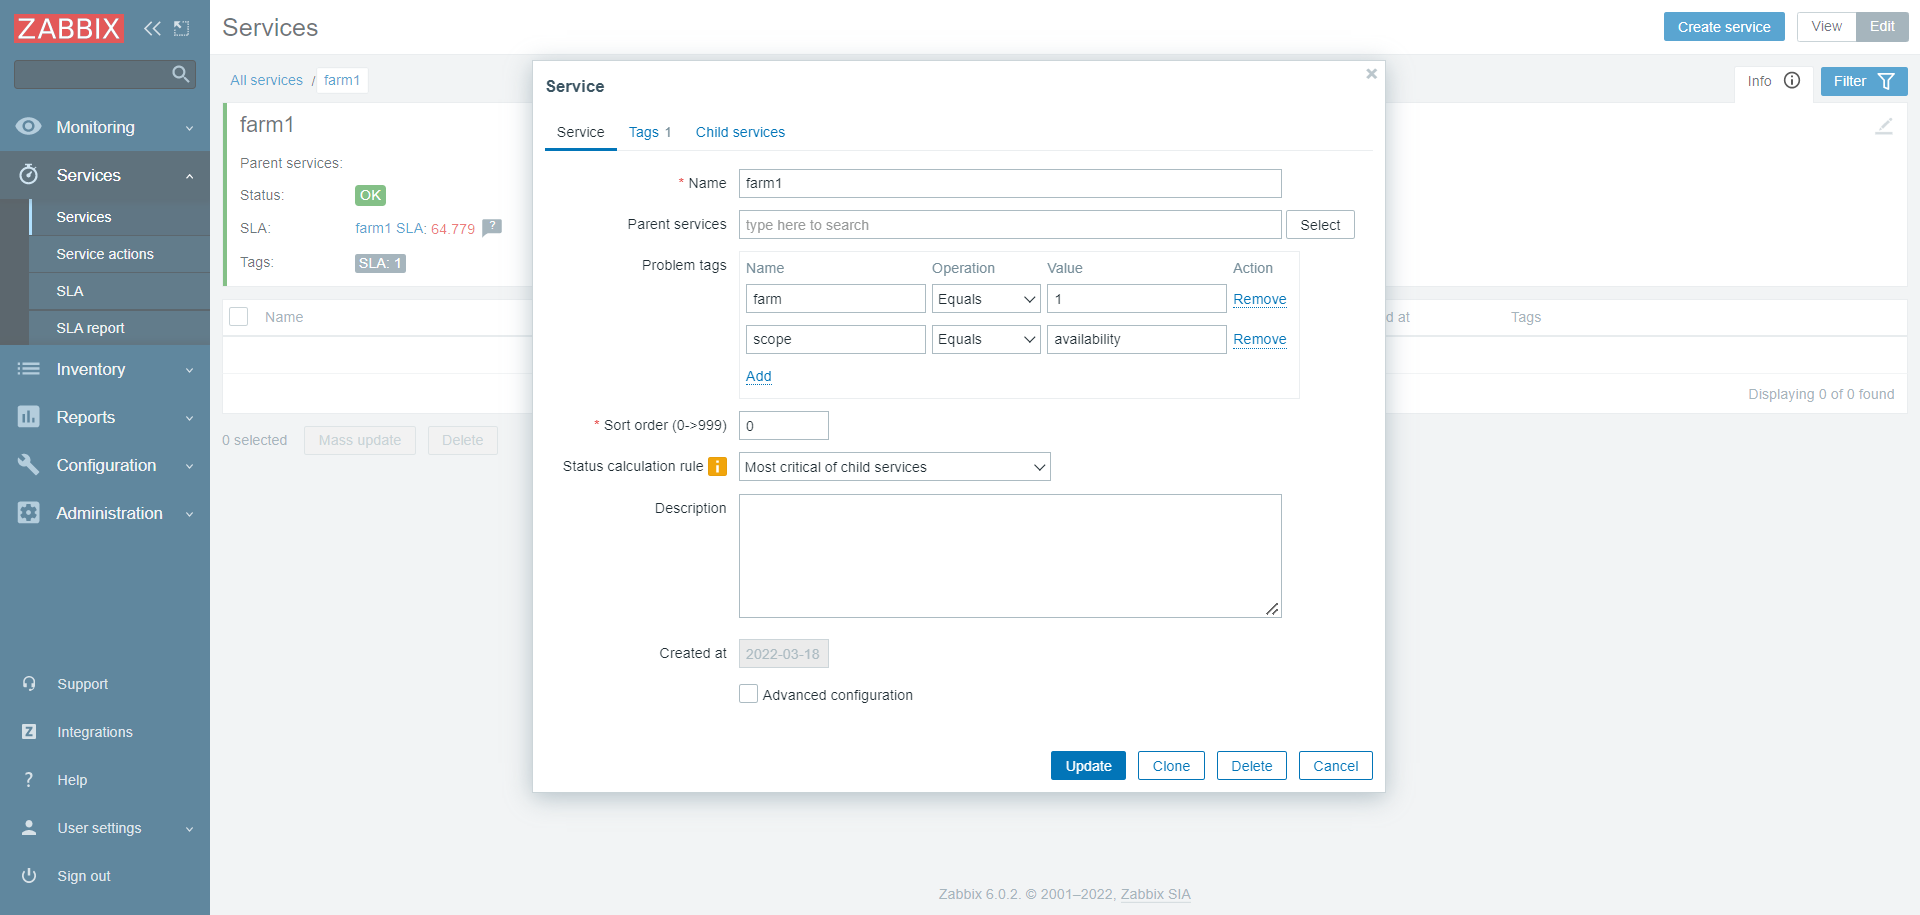
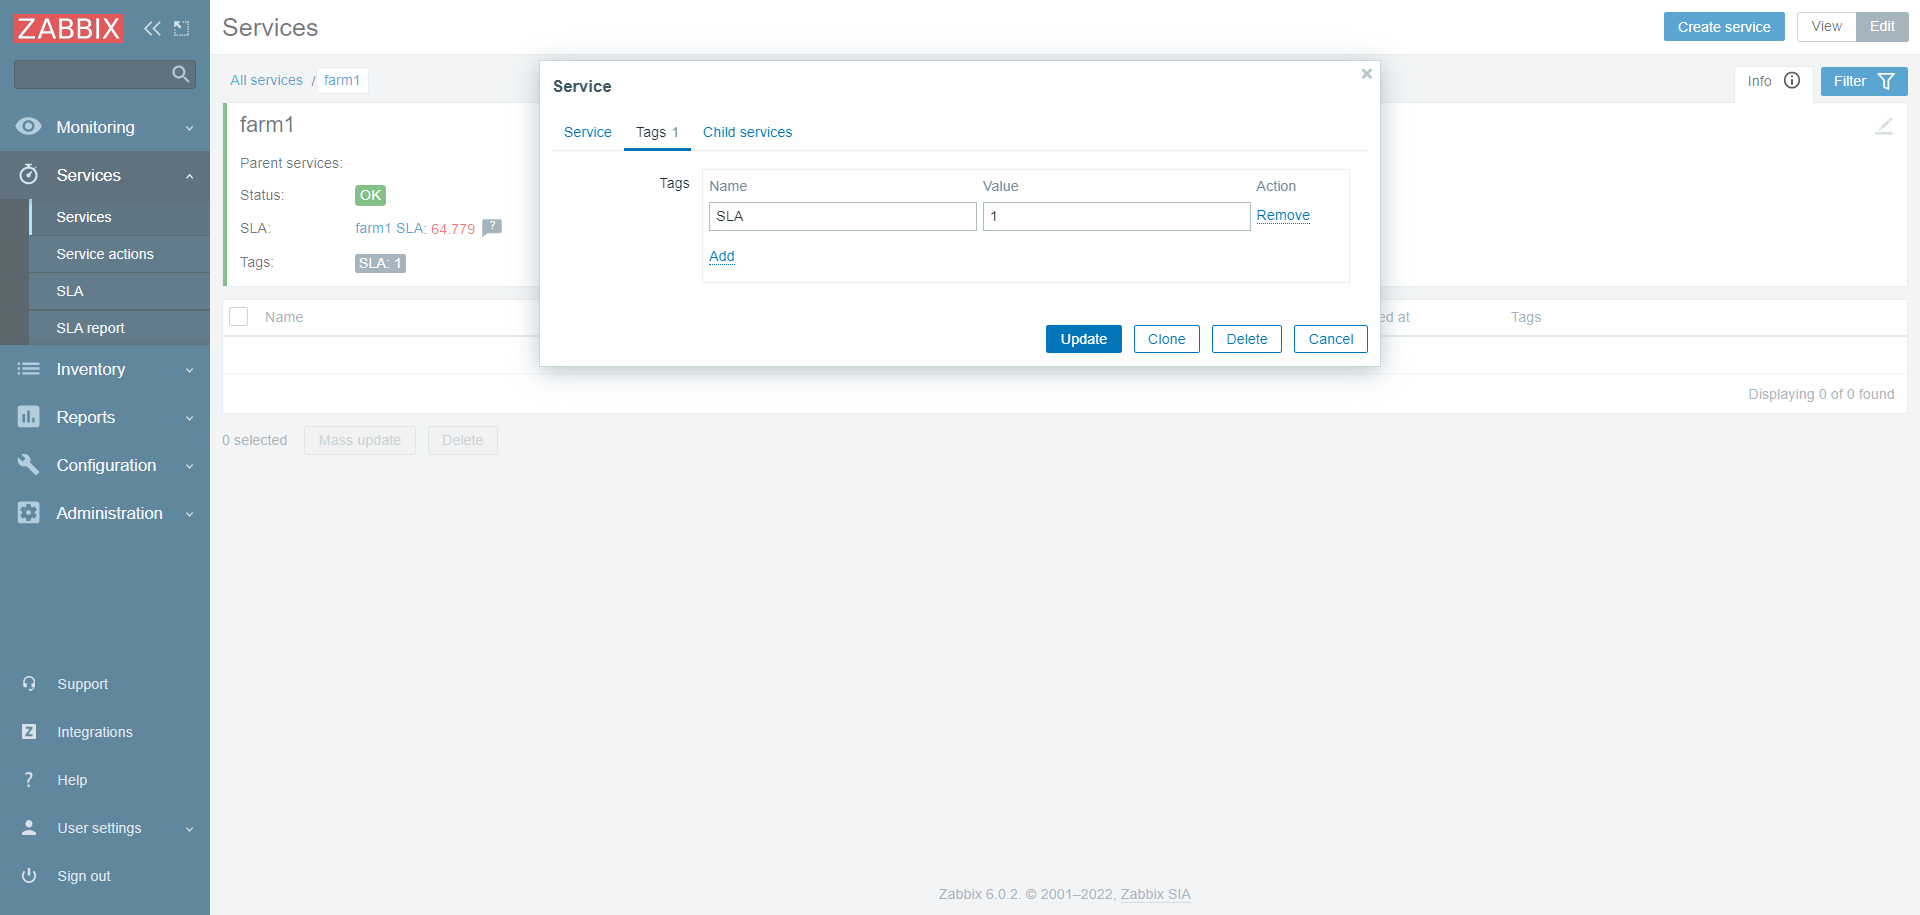
Services configuration:
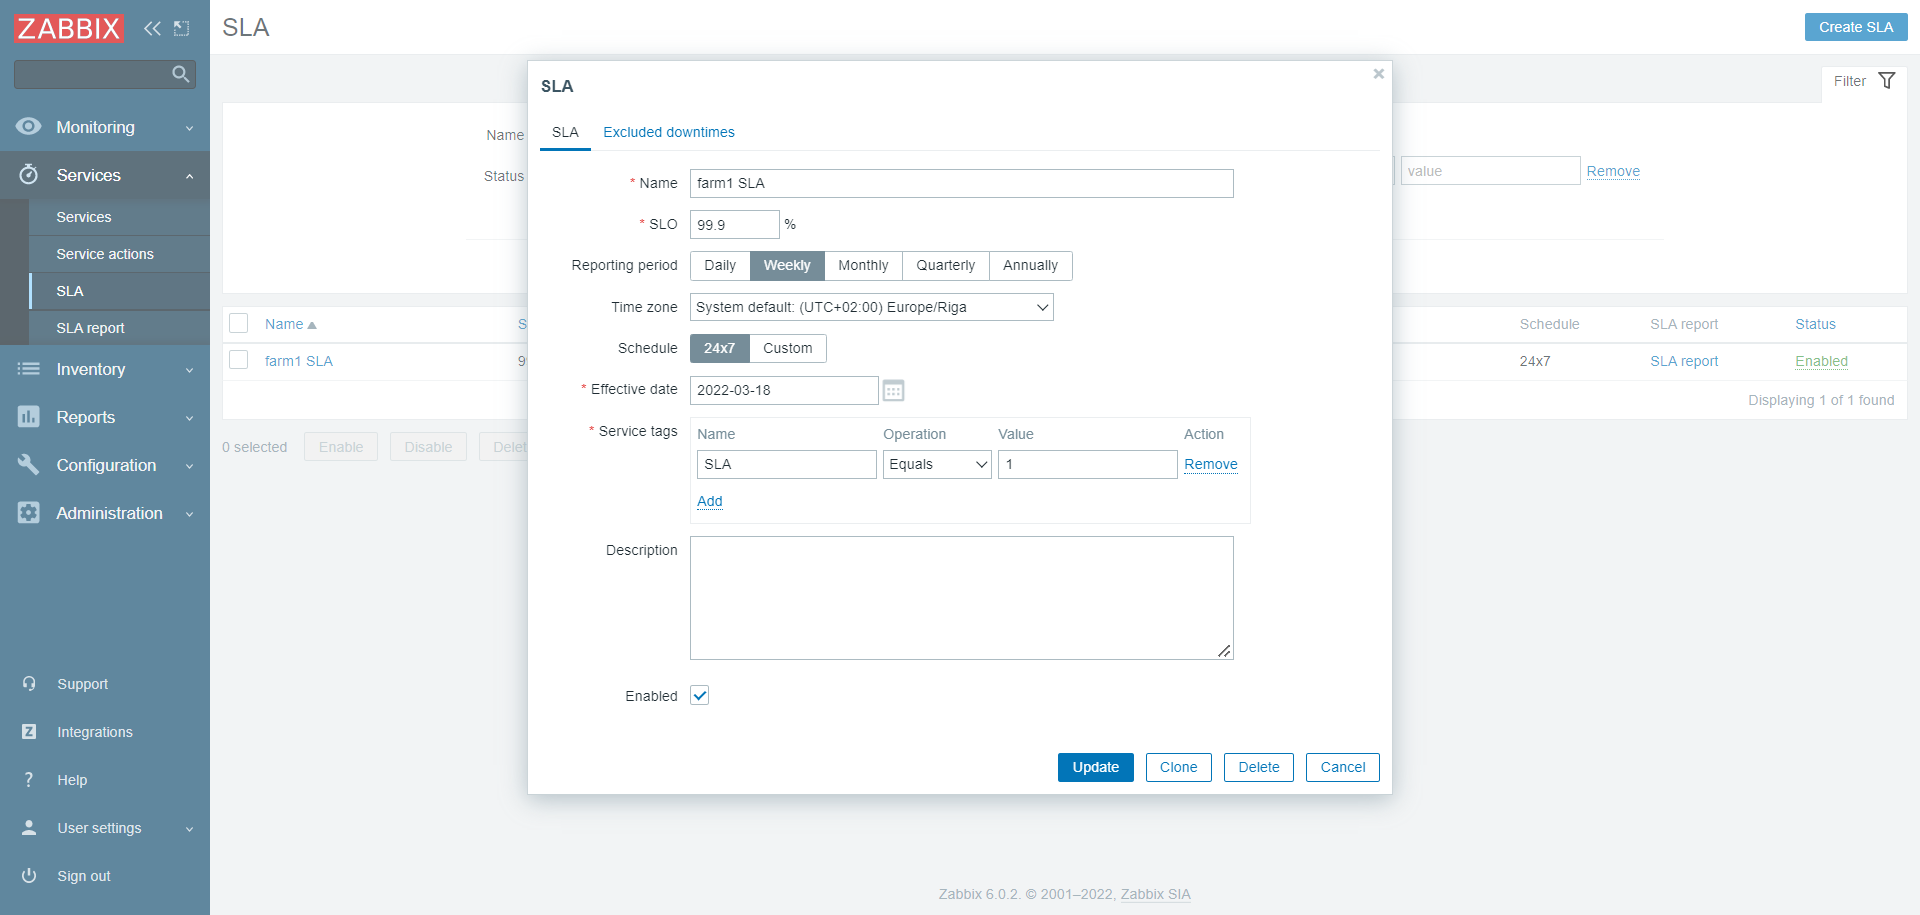
SLA conf:
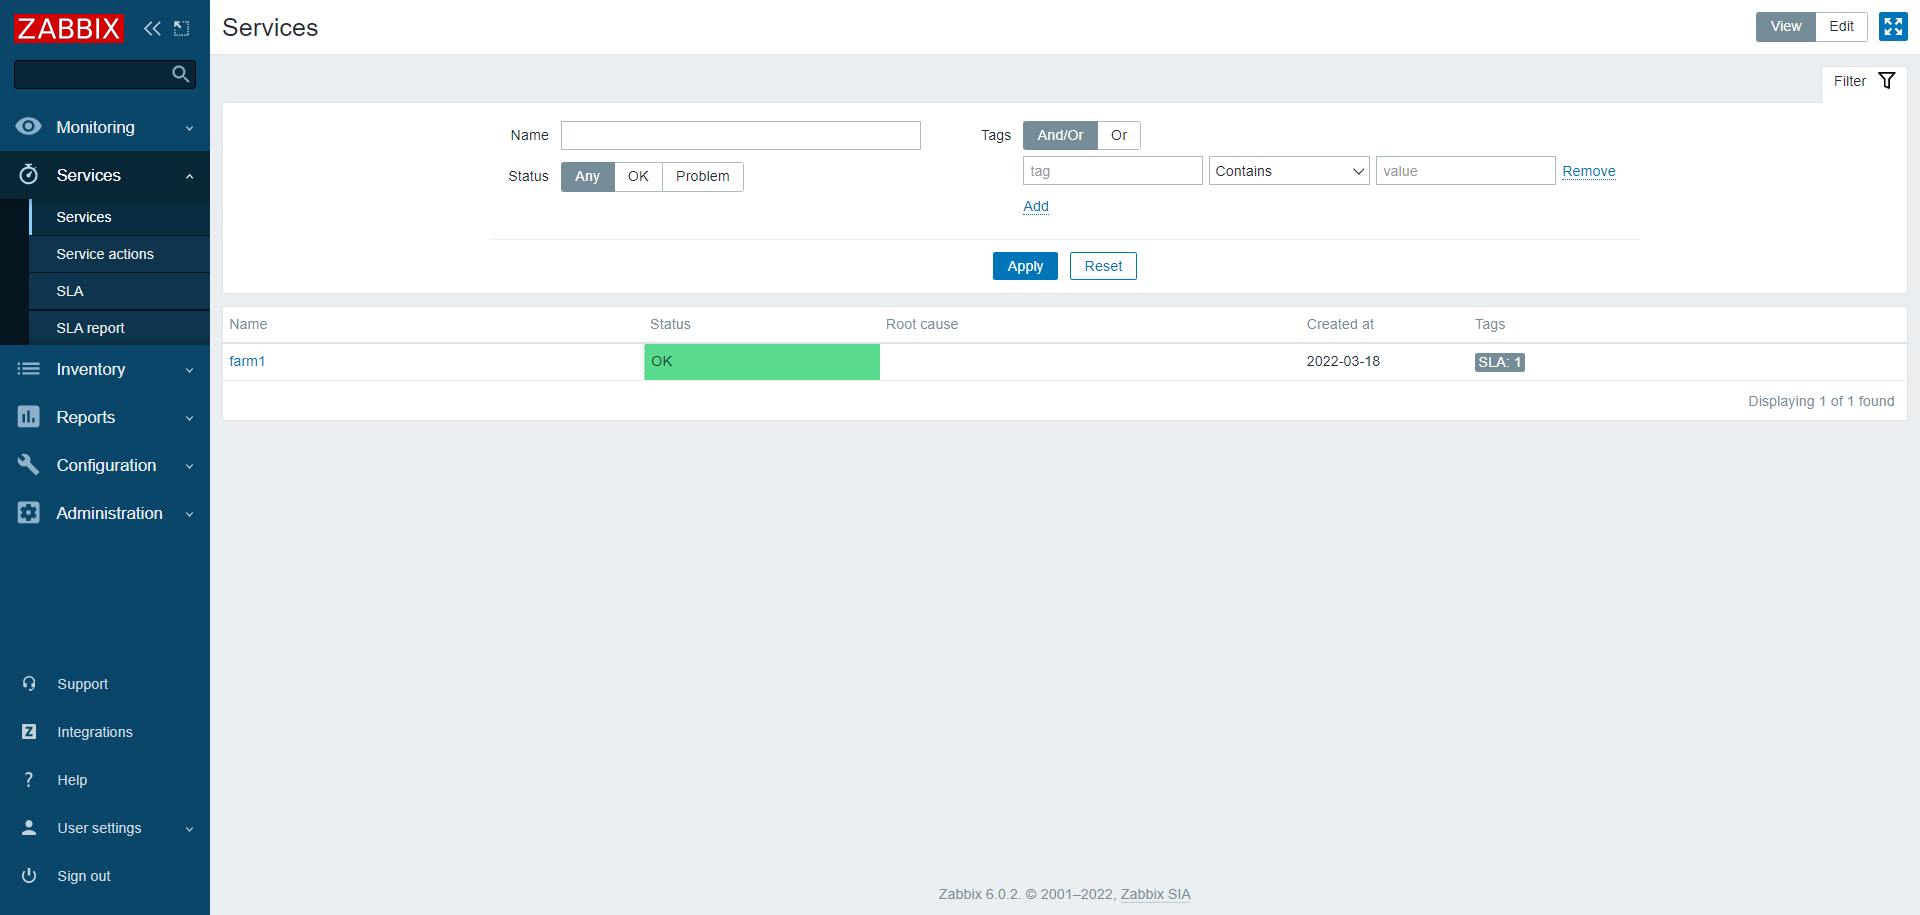
Now in a normal situation the picture looks like this:
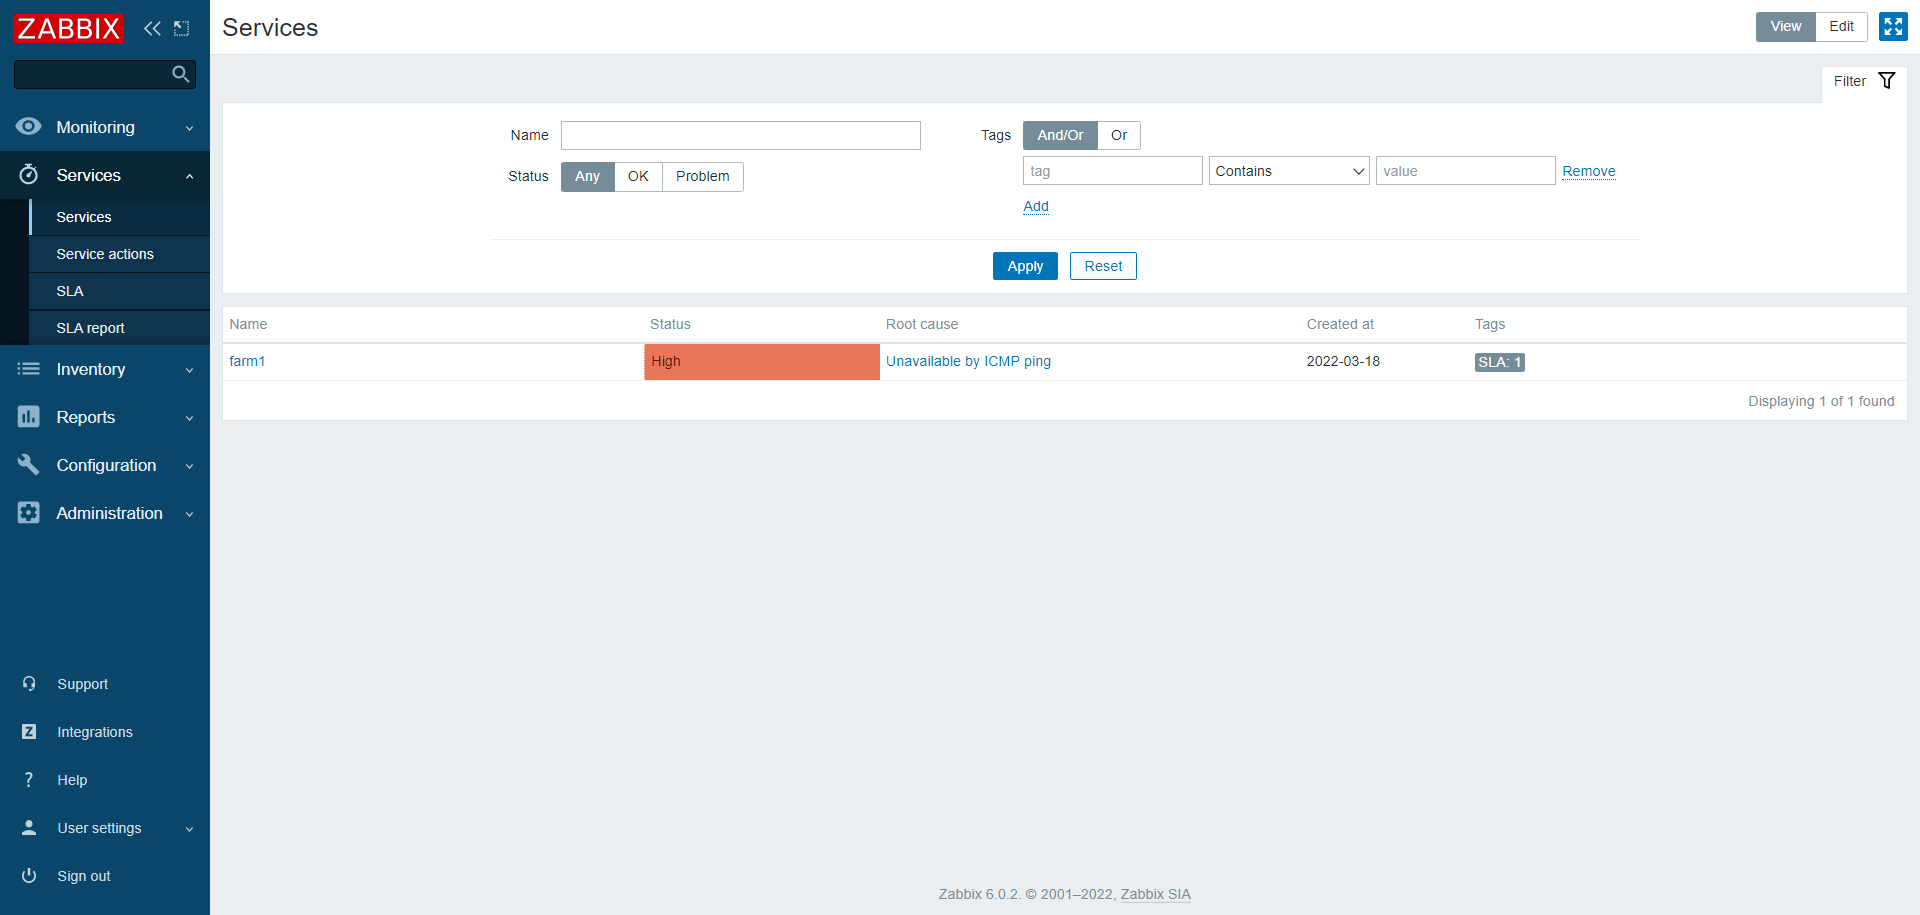
When there is a problem per one node, then it highlights the root cause:
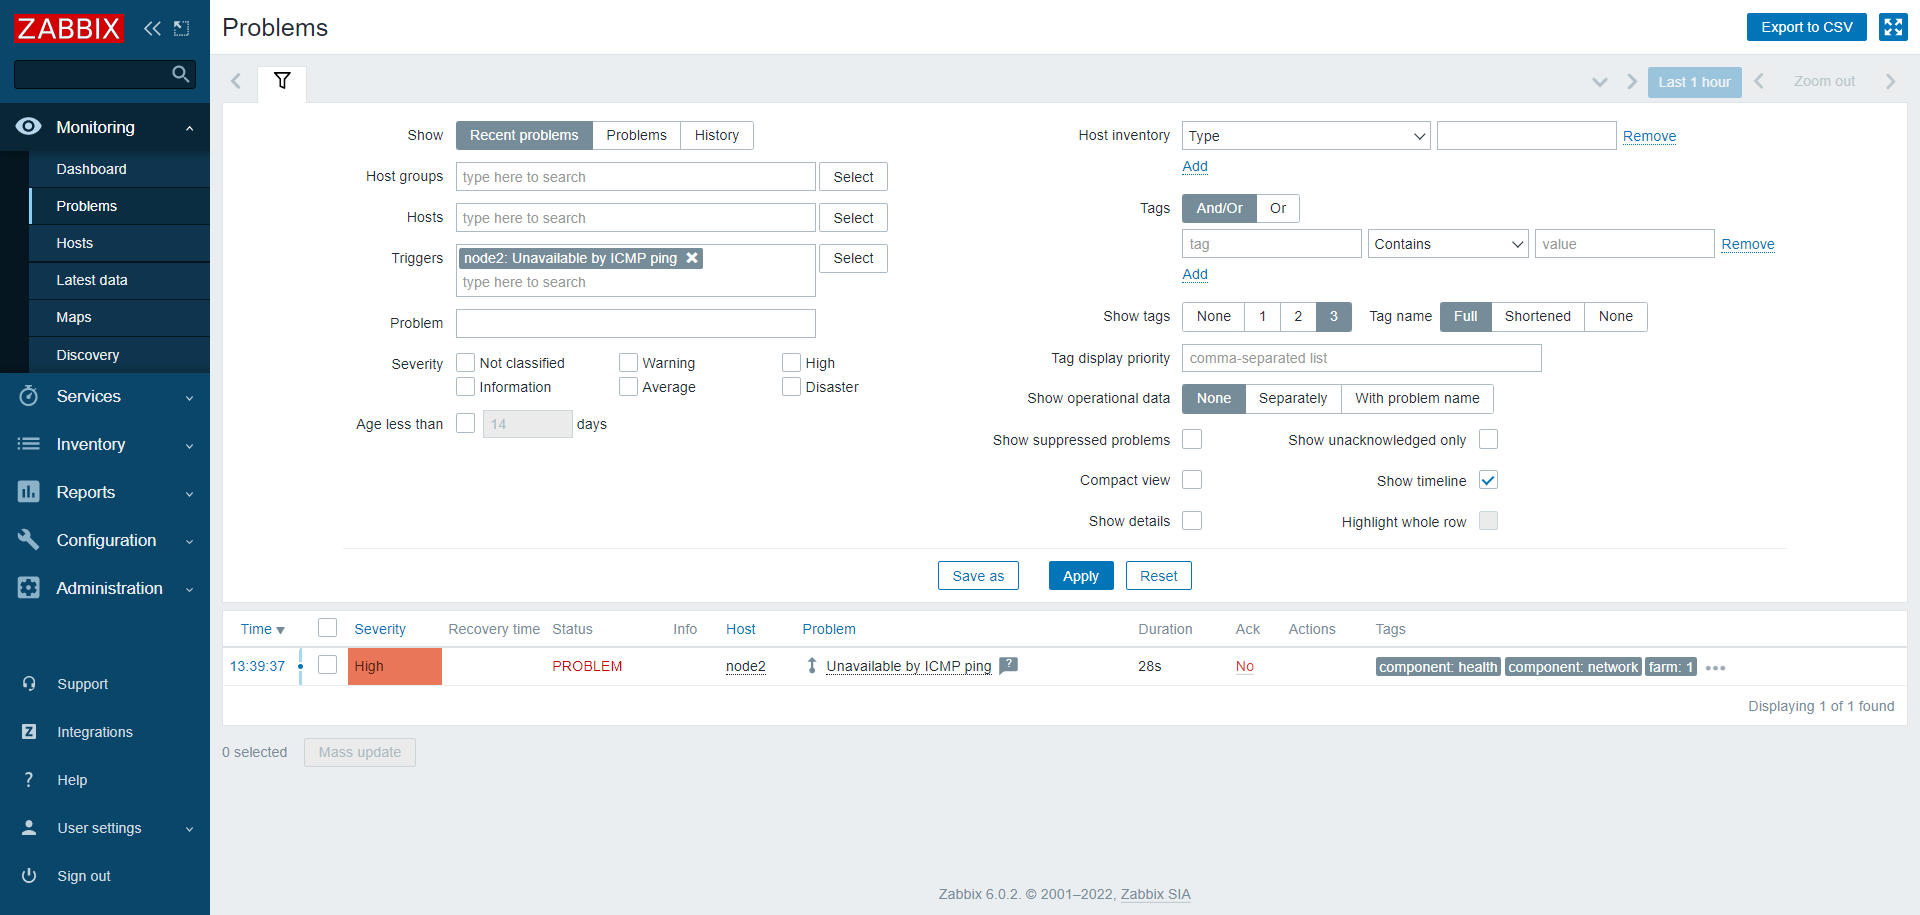
By clicking on the link we can see the root cause:
When it goes back to normal state:
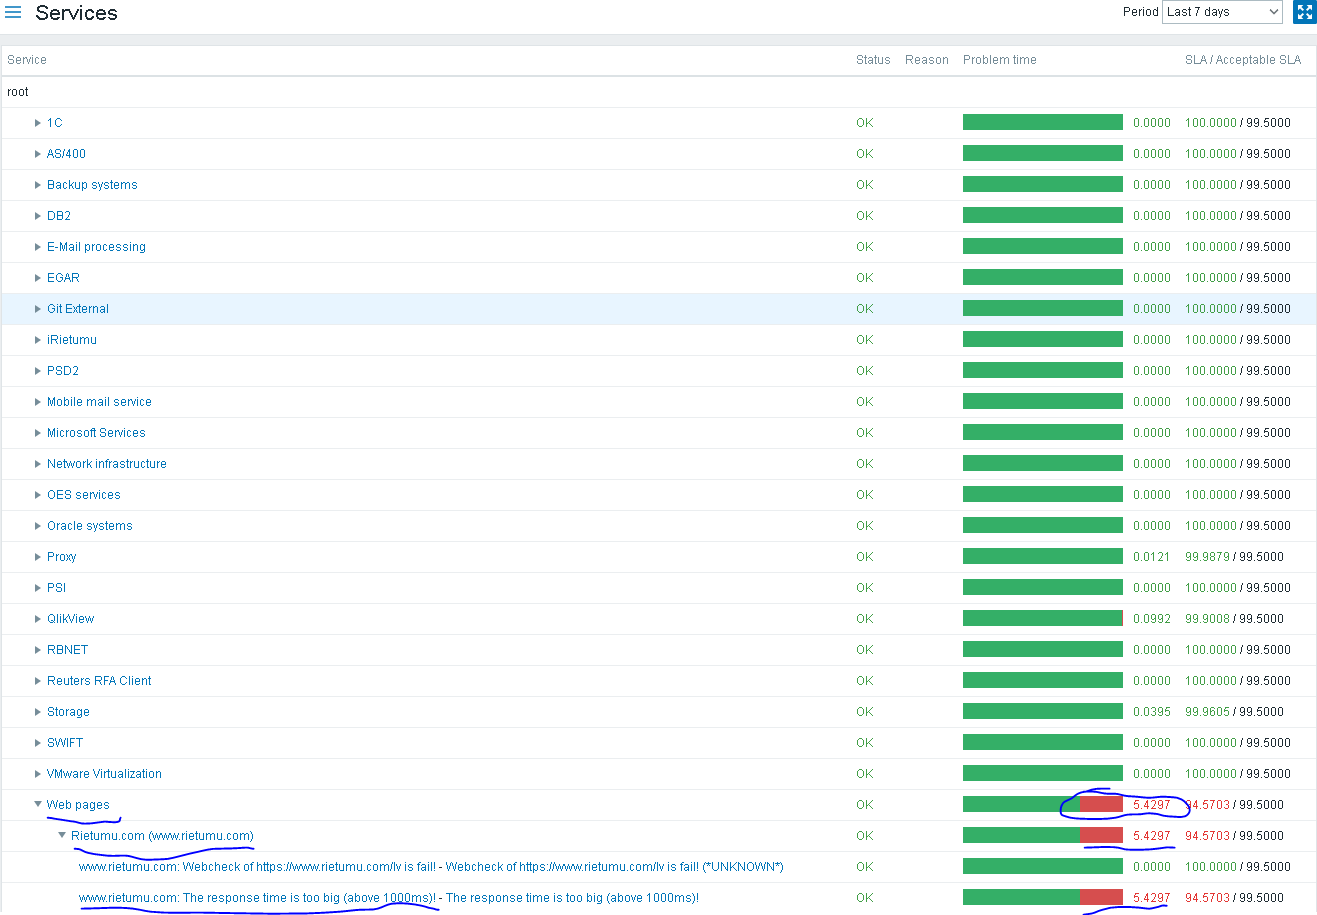
We can browse the SLA report to see SLO and SLI:
But there is no easy way to see what was the root cause for the SLA to drop. Kindly allow to see root cause for SLA drop straight from dedicated section. |
| Comments |
| Comment by Constantin Oshmyan [ 2022 Mar 18 ] |
|
Real use case. In the version 6.0 this functionality has been lost, it should be returned ASAP (or replaced by some other means). |
| Comment by Tomi Kajander [ 2022 May 17 ] |
|
This functionality should be essential in any SLA reporting tool. I second this feature request and hope that it can be reintroduced atleast similarly that it used to be in Zabbix 5.0. This was the biggest drawback when we upgraded from 5.0 to 6.0. |
| Comment by Constantin Oshmyan [ 2022 Oct 17 ] |
|
An additional note here: the "Root cause" column should include the host information also (additionally to the problem name). The real life case:
|
| Comment by WytheNet [ 2022 Dec 29 ] |
|
I agree with what Constantin Oshmyan said,It bothers me that a disabled host still calculates the SLA, it's deactivated as expected!I suspect it's a bug? |