|
Hi,
I have the same problem.
I'm trying to graph CPU Usage per Core through SNMP. I use SNMP LLD to get the dynamic count of the CPUs and have Item prototypes for "System Time", "User Time" and "Overall Usage".
Now I'm trying to create ONE GRAPH which contains all "System Time" values for the discovered CPU Cores. But I cannot configure this graph in my discovery rule.
This is pretty important for LLD graphing I would say.
br,
simon
|
|
Aggregate graphing of LLD discovered items seems impossible (using Zabbix 2.0.0rc2), but when done manually the graph doesnot show: I think it exceeds the number of items. In my case this is a large number ( > 128 physical ports and over 40 logical ports on a Cisco Core switch).
If this feature is implemented it will fail on graphs with large number of items. Also the query time and graph-generation will take up to much time: I have a screen with 8 graphs. 2 graphs (incoming/outgoing octect) for every stack within the switch (4). Each graphs has an avg op 24 ports. And by the time the last graph is displayed....refresh
A possible solution is by making 'aggregated' values from LLD-items WITHIN a host (preferrably with an regexp). And make that aggregated item available for graphing.
grt,
Peter
|
|
As a workaround, can a graph be created dynamically using API?
|
|
See also ZBXNEXT-1353 (similar but for screens)
|
|
The very useful feature and should be implemented as soon as possible.
The LLD can't be without such kind of graphs and will help to compare many different results.
|
|
I voted.
Waiting for that, too.
|
|
It should be considered for development.
|
|
There is some hope to have this feature in version 2.0.7? I should open a new ticket? this is reported to 1.9.5
|
|
this is currently not on the roadmap, and it can not go in 2.0.7 (amount of features going in 2.0 is very limited, and there would not be enough time to put this in 2.0.7 anyway)
|
|
sorry, insist  But LLD is one of the beautiful enterprise feature that zabbix have. All people that manage zabbix in company can have several benefits from LLD but, when i need to create some "complex" graph to show to my boss (that pay for zabbix support) if i say that i can't do a graph because we can't mix neither LLD items from others discovery rules nor fixed items, I don't know what he says LLD is incomplete (for only this limitation) and not usable in enterprise environment ... so, if you want don't add this feature in 2.0 but add this feature in the 2.2 roadmap ... my 2 cents But LLD is one of the beautiful enterprise feature that zabbix have. All people that manage zabbix in company can have several benefits from LLD but, when i need to create some "complex" graph to show to my boss (that pay for zabbix support) if i say that i can't do a graph because we can't mix neither LLD items from others discovery rules nor fixed items, I don't know what he says LLD is incomplete (for only this limitation) and not usable in enterprise environment ... so, if you want don't add this feature in 2.0 but add this feature in the 2.2 roadmap ... my 2 cents
|
|
What is the likelyhood of this expanding to allowing LLD graphs for the same item across multiple hosts in a hostgroup? Would this need to be a new feature request?
Currently if this is done, the graph is then copied to each host rather than remaining on a template which isn't such a big problem but as soon as you bring cloud computing in, it fails miserably when new instances spin up and old ones terminate.
|
|
Upvoted for this feature.
I just tried to create an aggregate SNMP-LLD based graph for all the vlans in our OpenBSD routers and the horror discovering this is not possible.
This is extremely useful to people monitoring cisco switches (distribution/access) or firewalls were it's nice to see an aggregated view of the traffic (similar to what Observium does).
|
|
Upvoted, i have a LLD rule that graphs about 60 NFS and create a percentage (pused) of each, but i also need to display a single graph with all items so i can have a quick look at which one is using >80% for instance, and the trends
right now i ended up adding the 60 different NFS as plain items...
|
|
Hello,
I also vote for cumulating of items in the same graph. I need it for disks IOtime / throughput etc. in discovery rules. Screen is not soluton. I can do manually, but it is not good solution for me.
|
|
Is this feature request currently on the roadmap?
|
|
you can see the roadmap at https://www.zabbix.org/wiki/Docs/roadmap
|
|
In other words, you have to wait couple more years
|
|
In other words, you have to wait couple more years
Well, not necessarily. There is always the option to put it on the road map by (co-)sponsoring development 
|
|
It is very useful feature, because when we trying to find defective disk in many disks, it is easy to find it in one global graph, than in many separate graphs. I voted also for this feature.
Here is nice page http://www.zabbix.com/development_services.php where on the bottom of this page is possibility to Contribute on specific feature. I think that it can be way how to promote some feature requests and to do something like crowdfunding on specific feature. Zabbix dev setup price and we can contribute on this feature I think it can be good way how to pay for each feature and to to pay whole development by one customer.
|
|
This request is most highly voted, but being ignored for 5 years. So, have to write simple plugin to implement the functionality:
https://github.com/sepich/glld
Hope DEVs would have time for LDAP groups now
|
|
sepa, you might be interested in ZBXNEXT-1099 too.
|
|
Support for this feature and a business case...
Part of our network is coax / DOCSIS. Stacked graphs are ideal for visualizing bonded upstream / downstream channels in DOCISS networks.
There are 18 coax operators in Norway - 17 operators are small privately owned companies (the other is the National telco - Telenor). Most coax operators I have seen in europe roll their own provisioning and surveillance - the surveillance side rarely scales well. Using zabbix as the surveillance / stats collection engine would be ideal.
There are also many other use cases for this feature - not just DOCSIS networks.
Many independent operators are be happy to purchase support if Zabbix has all the features required - mentioned by yayo above 5.july.2013.
sepa - good work. Ideally - we prefer to have the graph primitive generate the stacked graph.
|
|
+1 !! It is this kind of functionality that will overwhelm other monitoring tools
|
|
It will be more cool if this feature can be made available by introducing dynamic graphs without sticking to LLD.
Say, you want single graph with all your CPU loads in one place:
Just add regex mask like or something: cpu.load[.+]
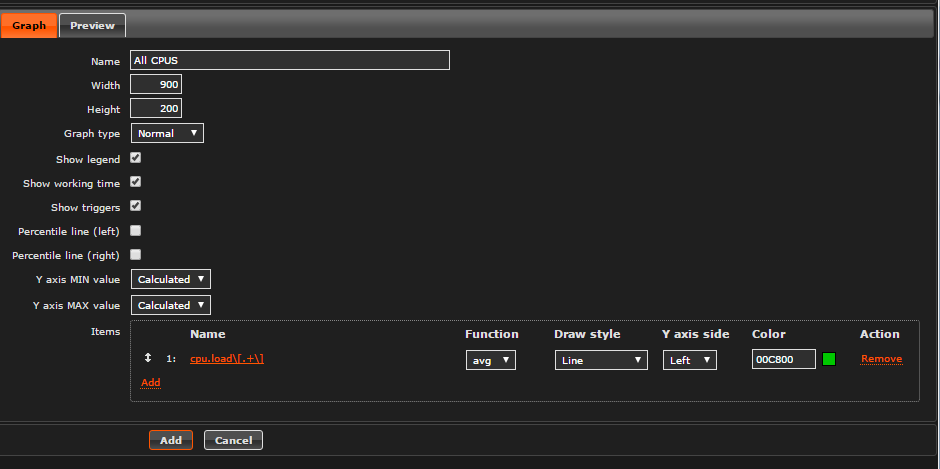
This is more general approach that will deliver this request as well as will allow to combine metrics that are from different LLD discoveries or from static part of the template, or same metrics from different hosts even could be combined like that. Like all loads of hosts in host group no matter how many hosts are there.
|
|
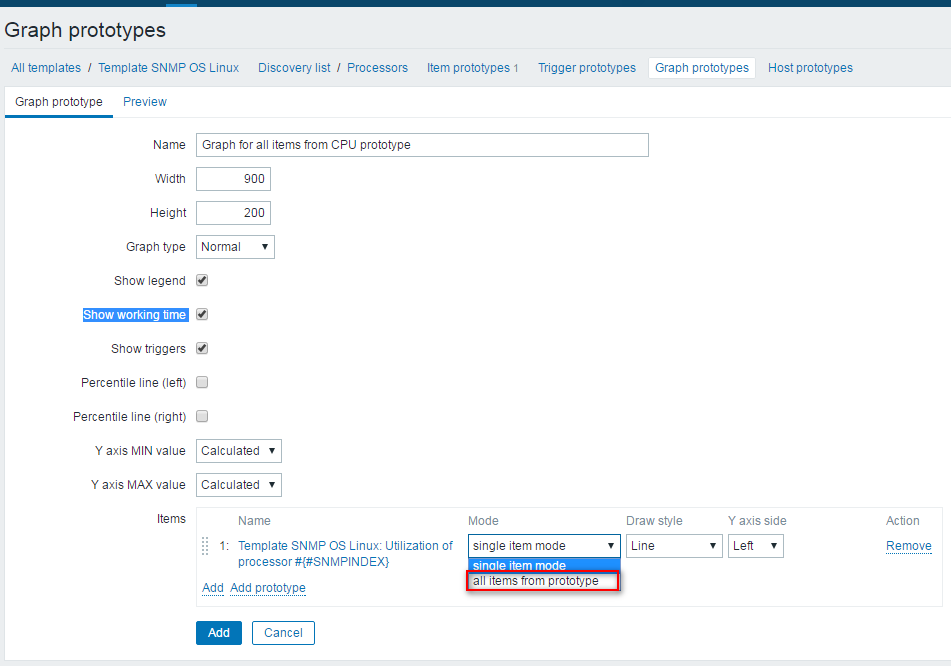
Or you just can implement it with something like that:
|
|
+1
Cool thing to compare items over time
|
|
i see your solution for having many item prototype in one graph but i dond know how to use it
for example how can i add regex mask in graph ?
should create item with regex ? how ?
or how can i see "Mode" list in my graph create page ?
by default can't see "Mode" in graph prototype
|
|
+1 Very usable feature: just now i have to build complex graph manually from 16 items discovered with 1 prototype. It is ARRGH... very confusing.
|
|
I would like to to create a stacked graph prototype that would stack all the item prototypes from the discovery rules.
If I understand this feature request correctly, it is not currently possible? If anybody would care to confirm.
Thank you!
edit: My use case is to discover all APs from a wireless controller and stack all their bandwidth use on a stacked chart to see areas of use.
|
|
@snicolas that's correct, what you're trying to do is not currently possible in the product, without some API work.
|
|
What I've done is written a script that searches for all items of the chosen key that aren't in "not supported" status and added them to a graph.
|
|
@Eric Smith is that a script you might be willing to share?
|
|
Thank you for the confirmation Eric!
|
|
Sure - how well do you know Python?
|
|
Not very well but I am fairly proficient with several other languages so I am sure I could figure it out.
|
|
Better late than never I guess, the attached script checks for the specific key to be added to a host based graph and then creates the graph, adding to it those discovered items that have state = 0 (supported).
|
|
Thank you very much for sharing Eric!
|
|
This functionality (and more!) is coming in Zabbix 4.0 under ZBXNEXT-4588 for dashboard graphs. I believe it will cover most of use cases like selection of items by item name and host name patterns.
|
|
Alexei, how do you see the new graph widget solving this issue? Will the graph widget be ported over to graph templates?
|
|
Alex, the new graph widget supports wildcards that can be used to make a graph having all LLD items displayed. I really hope that Zabbix 4.4 will deliver host level graphs with support of wildcards for a complete solution.
|
|
+1, Also interested in this feature
|
|
What's the likelihood of Host level graph wildcards coming to a 5.0.x point release? It's disappointing that this wasn't delivered in 4.4 (and hence 5.0). It'd be great to be able to template this at a host level, which you can't do with dashboard graphs.
|
|
I have more than 50 discovered interfaces that I need to aggregate (stack of the bandwidth) into a single graph. Can I do this with the Graph wildcard in the dashboard? Thanks
|
|
Hello,
No update for this "top voted" request feature ?
|
|
Has anyone found a solution to this? I have multiple supplies on a printer that I discover with a discovery rule and it would be great to show in one graph the level of all the supplies discovered.
|
|
Hello,
You can make it with Dashboard on the future version 7.0 :
! 
|
|
Of course in manual mode you can do it. Even in 2.4 you can do it!
Main topic its to do it automated and make graph.
|
|
Yes, It Is solved. I do not remember exact version. 5.x
In my case, on a router, now I can create sum of items, based on description, and use these items on a graph.
|
|
Same here. It would be nice to have ability to add to a graph prototype all discovered prototype items, so that I can see all of them in one place.
My use case: i have many servers with openvpn server installed. Each server may have from 2 up to 16 processes of openvpn. I've created discovery rule to detect openvpn instances on a server, but I can't display them in one graph. I.e. I want to display bandwidth, connected users, etc per each openvpn instance in a server on a the graph prototy. But instead, zabbix generates a graph per each discovered openvpn instance.
|
|
mma, can you please expand on your comment about version 7.0?
I have explained my use case in this forum post: https://www.zabbix.com/forum/zabbix-help/476654-support-for-dynamic-assignment-of-prototypes-on-the-same-graph-prototype#post476715
|
|
We need to create (svg?) graphs from lld items using pattern and agreagate functions.
We can make a general dashboard with discovered items but we cannot generate a template graph with these features.
Today, we only make lld graph for each occurrence.
|
|
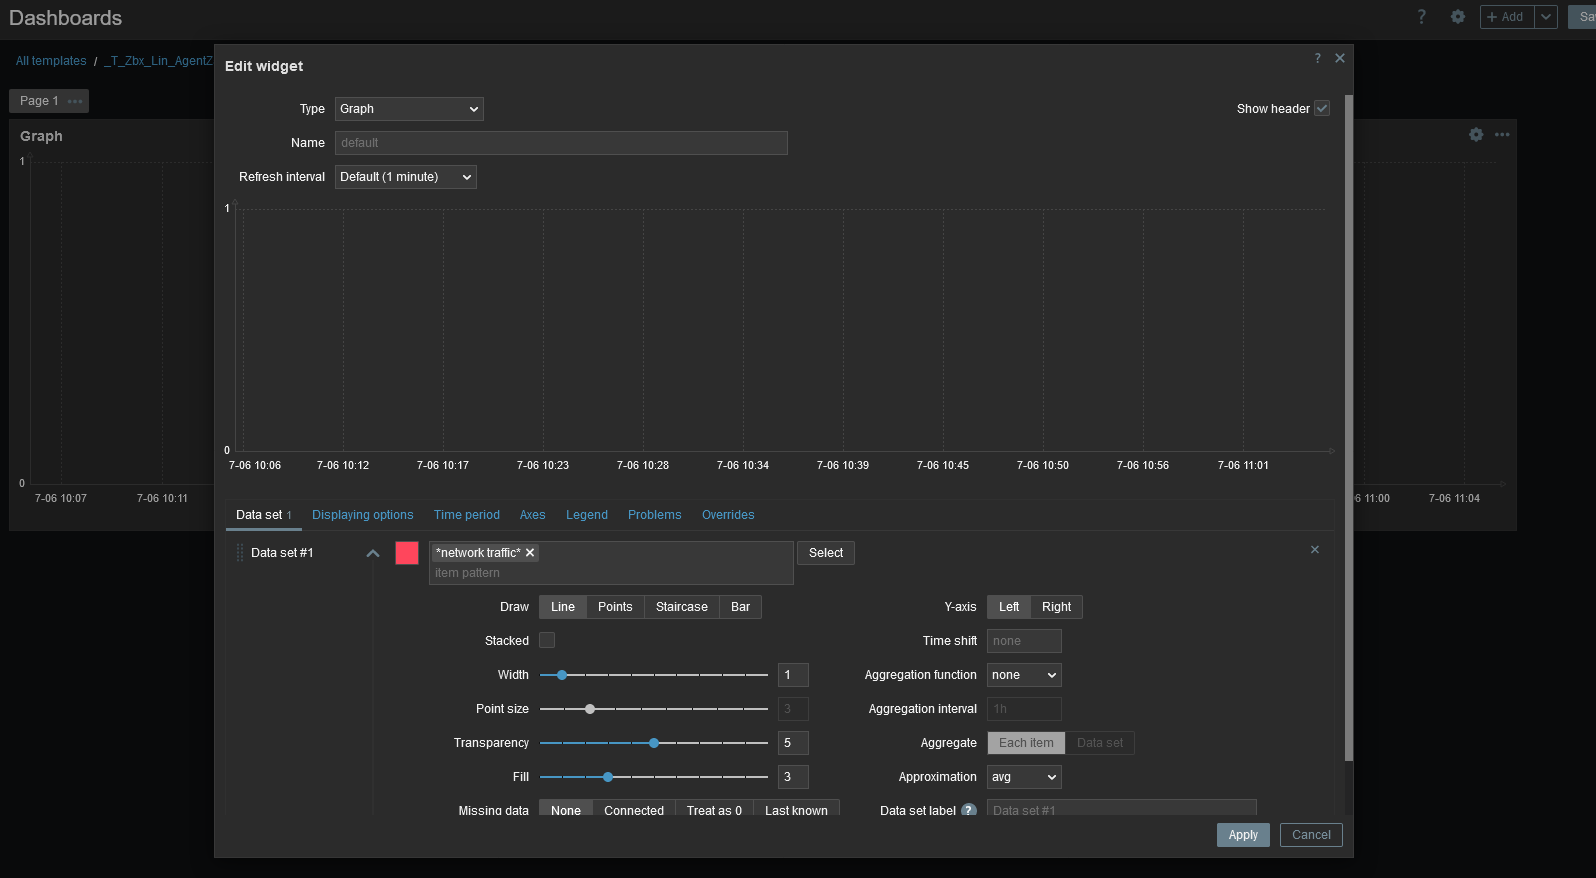
I think, resolved by https://www.zabbix.com/documentation/current/en/manual/introduction/whatsnew700#expanded-widget-availability-on-template-dashboards
You can make SVG graph with the regex matching your discovered items, like "Interface *: Bits received" on the template Linux by Zabbix agent for example.
|
|
Can this be considered resolved? Any use cases not covered by >= 7.0 ?
|
|
Closing. First implemented in SVG graphs in global dashboards, in 7.0 SVG graphs added to template dashboards.
|
Generated at Wed Jul 16 10:16:59 EEST 2025 using Jira 9.12.4#9120004-sha1:625303b708afdb767e17cb2838290c41888e9ff0.