-
Type:
Incident report
-
Resolution: Fixed
-
Priority:
 Trivial
-
Affects Version/s: 3.0.6, 3.2.2
-
Component/s: Frontend (F)
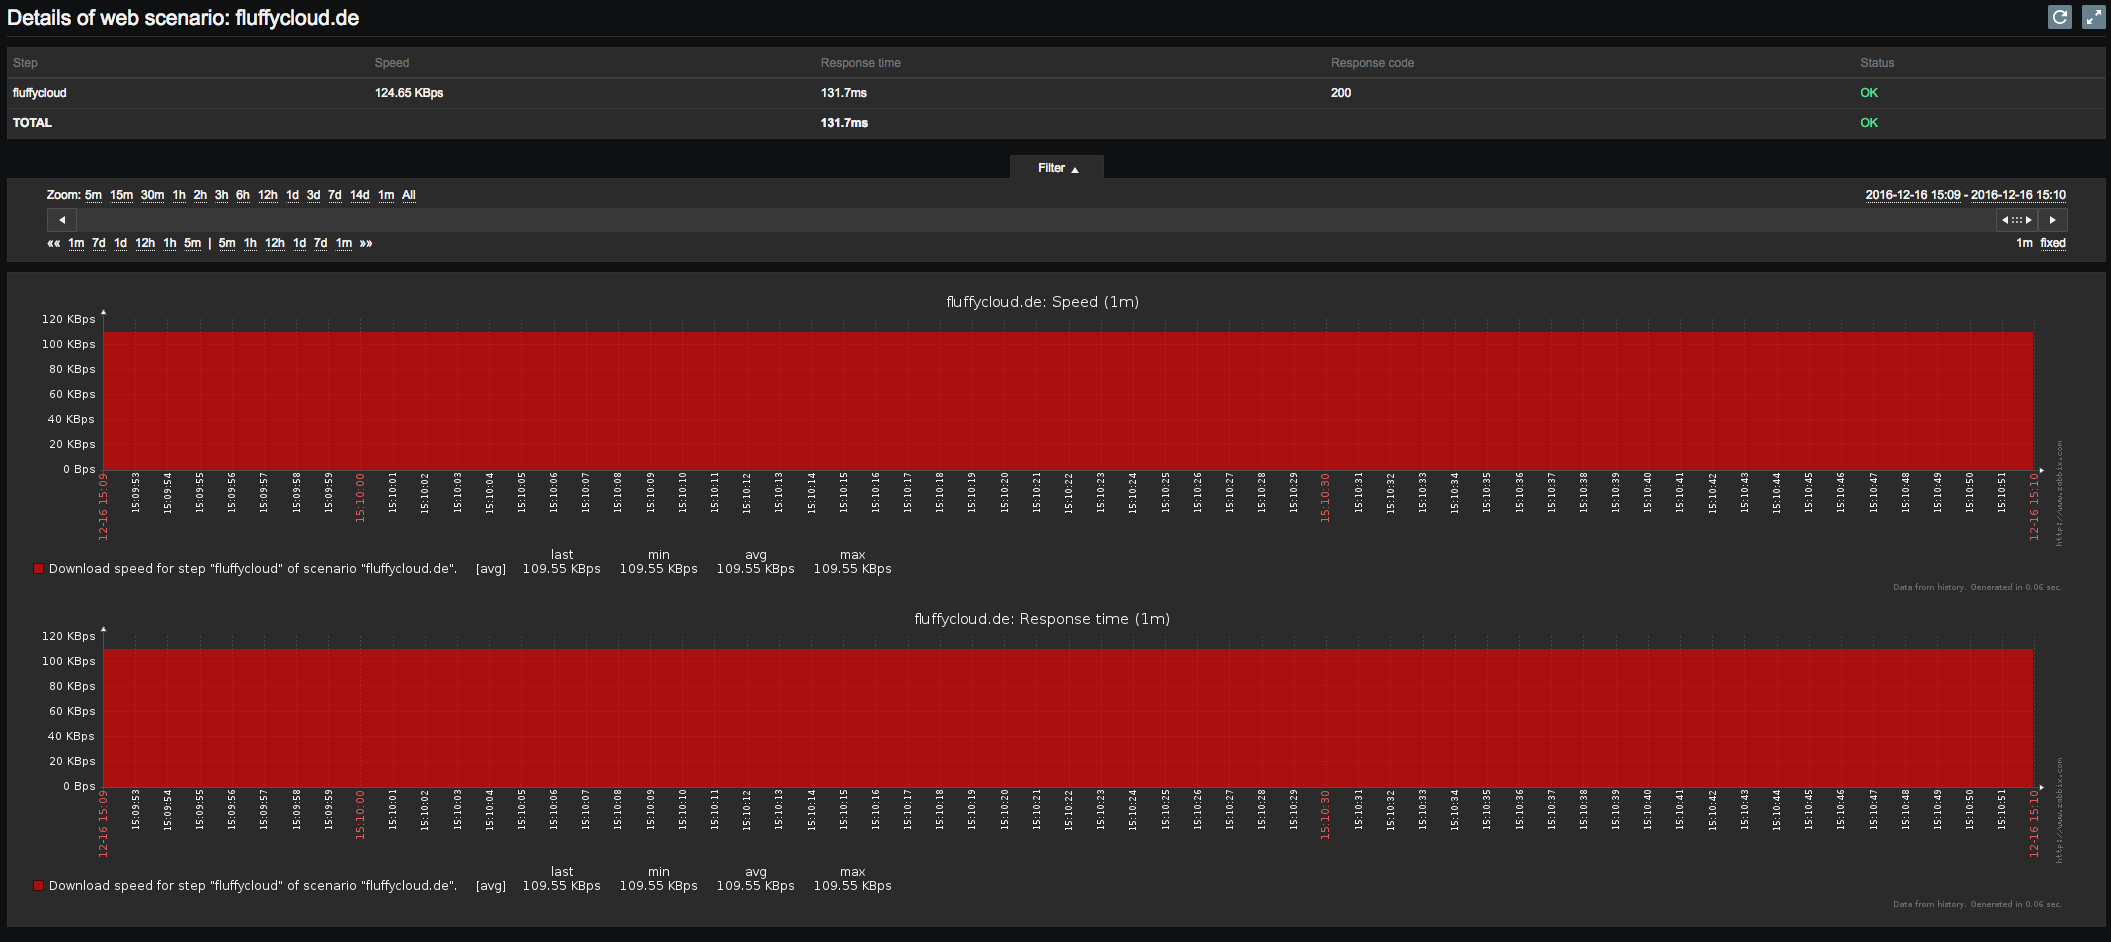
Hello Devs.
Just saw there is no response time graph anymore. Instead there are two "download speed" graphs. Any idea what could be the cause of this?
See attachement.
- is duplicated by
-
ZBXNEXT-3664 Web monitoring view wrong graphs
-

- Closed
-
-
-
- Closed
-