-
Type:
Incident report
-
Resolution: Duplicate
-
Priority:
 Trivial
-
None
-
Affects Version/s: 3.0.7
-
Component/s: Server (S)
-
None
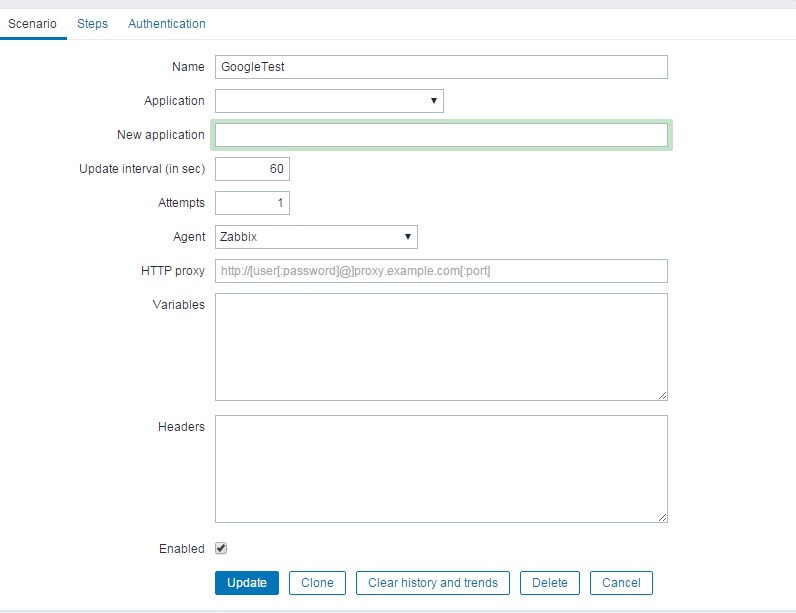
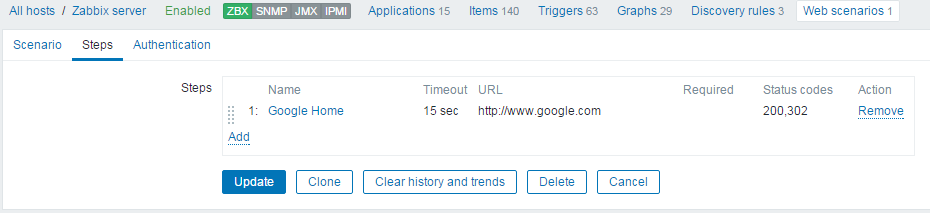
I have configured zabbix web monitoring to monitor external website such as google.com using zabbix 3.0.6
It start receiving data for download speed and response time of google.com but the graph of response time was not appearing properly.Its showing same as download speed . In zabbix 2.2, its was showing perfectly
I have attached the steps , scenario and web monitoring graph.
I don't understand why its showing only the download speed in place of response time.
Anybody please help.
- duplicates
-
-
- Closed
-