-
Type:
Incident report
-
Resolution: Fixed
-
Priority:
Critical
-
Affects Version/s: None
-
Component/s: Frontend (F)
-
None
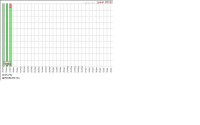
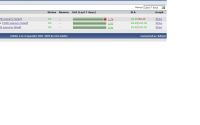
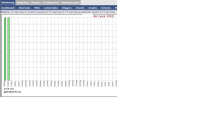
In the Monitoring->IT-services (SLA) time period that is shown on the second screen is not correct.
On the first screen all is fine, all is displayed correctly, but after clicking on "Show" ("show" in the Graph column) on the second screen is shown graph for the other date.
Appropriate post on the Zabbix forum: http://www.zabbix.com/forum/showthread.php?t=15392


