-
Type:
Problem report
-
Resolution: Won't fix
-
Priority:
Trivial
-
None
-
Affects Version/s: 5.0.0
-
Component/s: Frontend (F)
-
Environment:Chrome and Edge explorers on W10 SO.
Zabbix Server 5.0.0 deployed on Ubuntu Server 18.04.
Zabbix Server 5.0.0 LTS and both passive and active proxies updated to the same version (following the docs and updated OK) with no more than 10 minutes queue.
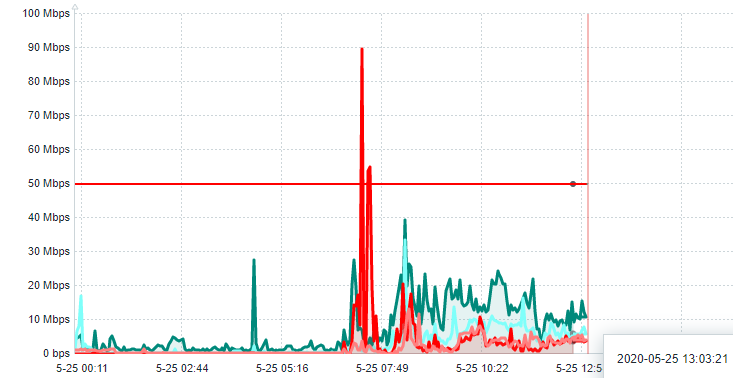
Since the update, graph widgets are not showing the data correctly when putting the filter on "Today". The graph draws back in the same graph the current data but several minutes before, here's and example:
Filter: today.
Latest data: 13:03
Point position: 12:43

There is a delay on all graph widgets, and on all dashboards, but the latest data is current and we have no queues. I can't point to the last data received on the graph. This effect appears with data collected both from the server and proxies, no difference. It's like de UI is "painting the current data now and 20 minutes ago", and the configured fill for the dataset dissapears in that time range.
If you zoom the above screenshot a bit, you can see that the widget is painting the same value now and 20 minutes ago and joining both points with an horizontal line.
If i open the graph of an item, the "simple" graph shows it correctly. Here's an example of the RED dataset shown above (it's shown OK):

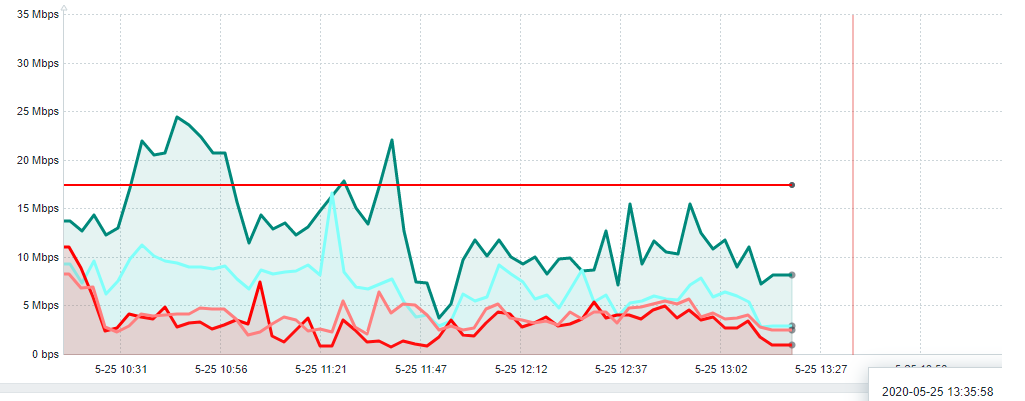
If i change the filter from today to now-3h to now+1h, all the dashboards and graph widgets shows the data OK and i can point to the real latest data (and the fill is shown as expected):

- caused by
-
ZBX-16162 Draw Graph line complete when Discarding values with Heartbeat
-
- Closed
-


