-
Type:
Problem report
-
Resolution: Fixed
-
Priority:
 Trivial
-
Affects Version/s: 5.0.11, 5.2.5, 5.4.0
-
Component/s: Templates (T)
-
Environment:Windows server 2016, agent2
-
0.5
Steps to reproduce
- link Windows physical disks by Zabbix agent to Windows host
- check graph Disk Utilization
Result:
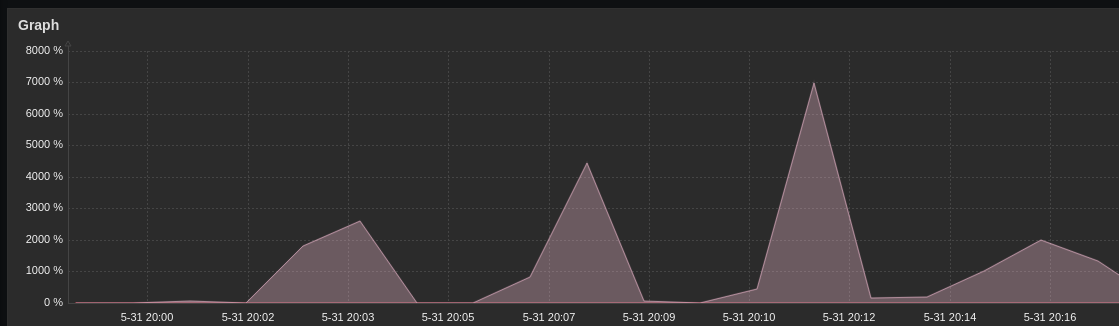
Expected:
Correct utilization by Disk Idle Time. wrong upside, correct -down.

Problem are perf_counter_en"\PhysicalDisk({#DEVNAME})% Disk Time",60
MS explain https://docs.microsoft.com/en-us/archive/blogs/askcore/windows-performance-monitor-disk-counters-explained
%Disk Time (% Disk Read Time, % Disk Write Time)
The “% Disk Time” counter is nothing more than the “Avg. Disk Queue Length” counter multiplied by 100. It is the same value displayed in a different scale.
If the Avg. Disk queue length is equal to 1, the %Disk Time will equal 100. If the Avg. Disk Queue Length is 0.37, then the %Disk Time will be 37.
This is the reason why you can see the % Disk Time being greater than 100%, all it takes is the Avg. Disk Queue length value being greater than 1.
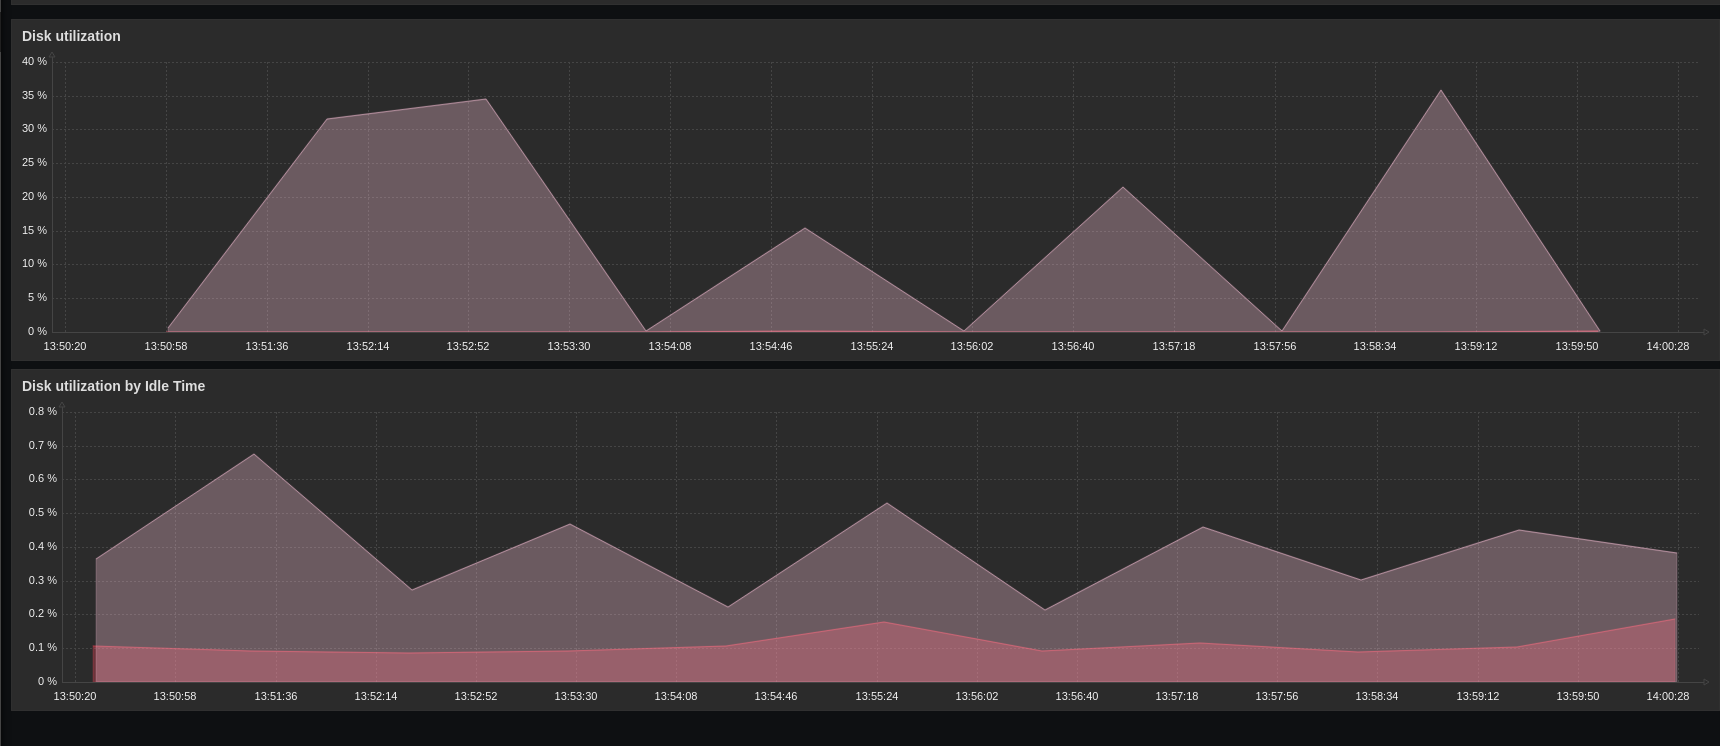
Second graph are with witch seems ok for me and show 1=1 with performance monitor in task manager disk tabs.
perf_counter_en"\PhysicalDisk({#DEVNAME})% Idle Time",60
With java script "return (value - 100) * -1"
this issue can resolv also 18869

- duplicates
-
-
- Closed
-