-
Type:
Problem report
-
Resolution: Fixed
-
Priority:
Trivial
-
Affects Version/s: 5.0.13
-
Component/s: Templates (T)
-
None
-
Sprint 83 (Dec 2021)
-
1
Steps to reproduce:
- Go to dashboard Zabbix server health in clean installation 5.0.13 and above.
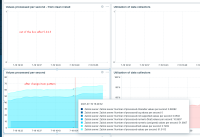
- See widget without graphs.
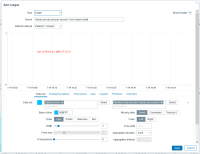
- For example Values processed per second with item pattern Number of processed *values per second
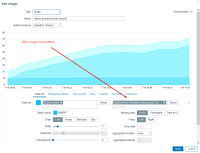
- Change item pattern to Zabbix server: Number of processed *value and - its works
- is duplicated by
-
ZBX-20209 Default dashboard Zabbix server Health broken
-
- Closed
-


