Steps to reproduce:
- Configured the zabbix web service, made sure it can see the zabbix server.
- Navigate to screen Reports, Sheduled reports. Fill in the dashboard, start end time etc.
- Use the Test button or schedule the report for a specified time
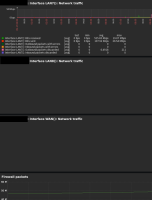
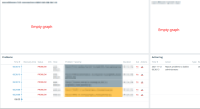
- The pdf arrives but the graphs are empty
- There are no error logs in the zabbix web service logs (log level set to 4)
Result:
See screenshot...
Nothing meaningful in the log file:
2021/11/12 08:40:00.259937 received report request from XXX.XX.X.X:XXX
2021/11/12 08:40:02.623979 writing response for report request from XXX.XX.X.X:XXX
Expected:
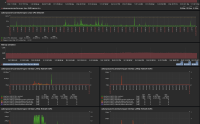
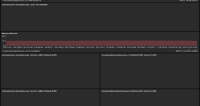
Expected results is that report will contain graph if not that the zabbix web service logs why the graph generation failed. Almost no errors are logged at this point.
- duplicates
-
ZBX-25269 Scheduled reports graph prototypes not working
-
- Closed
-


