-
Type:
Problem report
-
Resolution: Fixed
-
Priority:
 Minor
Minor
-
Affects Version/s: 6.2.3
-
Component/s: Agent (G)
-
None
-
Environment:Windows Server 2019 Standard with Version 10.0.17663.
-
Sprint 103 (Aug 2023), Sprint 104 (Sep 2023), Sprint 105 (Oct 2023), Sprint 106 (Nov 2023), Sprint 107 (Dec 2023), S2401, S24-W6/7, S24-W8/9, S24-W10/11
-
1
Description
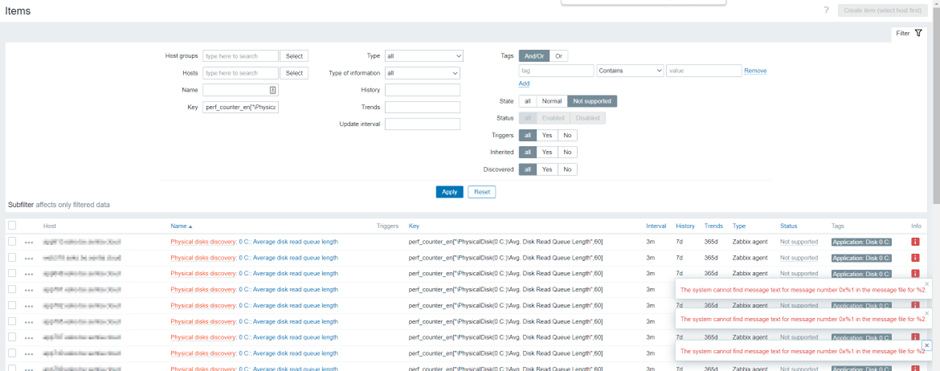
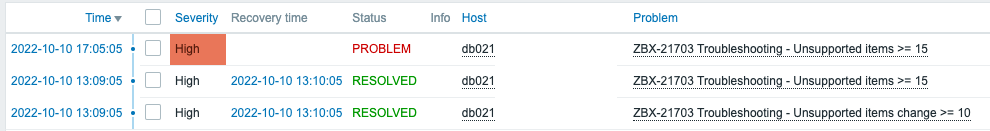
We see on a significant number of servers that Zabbix agent2 is no longer retrieving performance counters on windows servers after a period of time. We see this behaviour with different Zabbix agent 2 (v6.0.4, v6.2.1 and v6.2.3). In the Zabbix UI items with performance counters become “not supported”. In Zabbix agent v6.0.4 and v6.2.1 the agent crashes when this happens, in agent v6.2.3 the Zabbix agent keeps running, but those items stays in unsupported state and never resolves.
On all machines that are having these issues, we’ve concluded that (thus far) the OS Edition is exactly: “Windows Server 2019 Standard” with Version ’10.0.17663’. No other versions are found in our problem scope at this point. In case this changes, we will update this ticket accordingly.
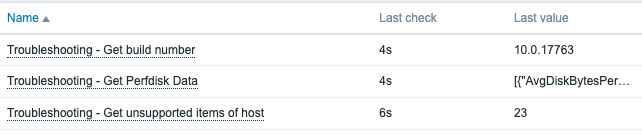
On the impacted assets we can see this error message “The system cannot find message text for message number 0x%1 in the message file for %2.” In the UI:
On the impacted assets we can see this in de eventlog:


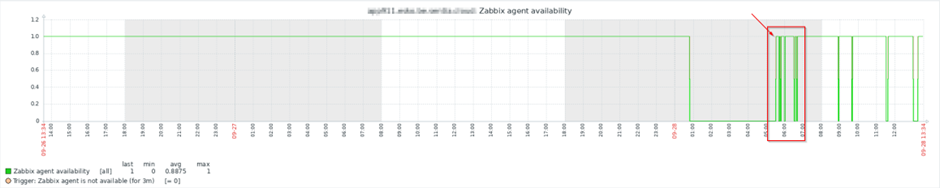
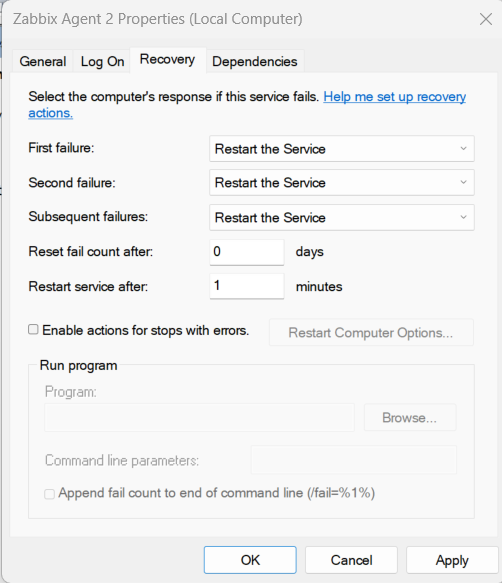
When we restart the Zabbix agent the issue is resolved, but reoccurs after a period of time. As we have over 1000 assets we need a permanent fix for this behavior.
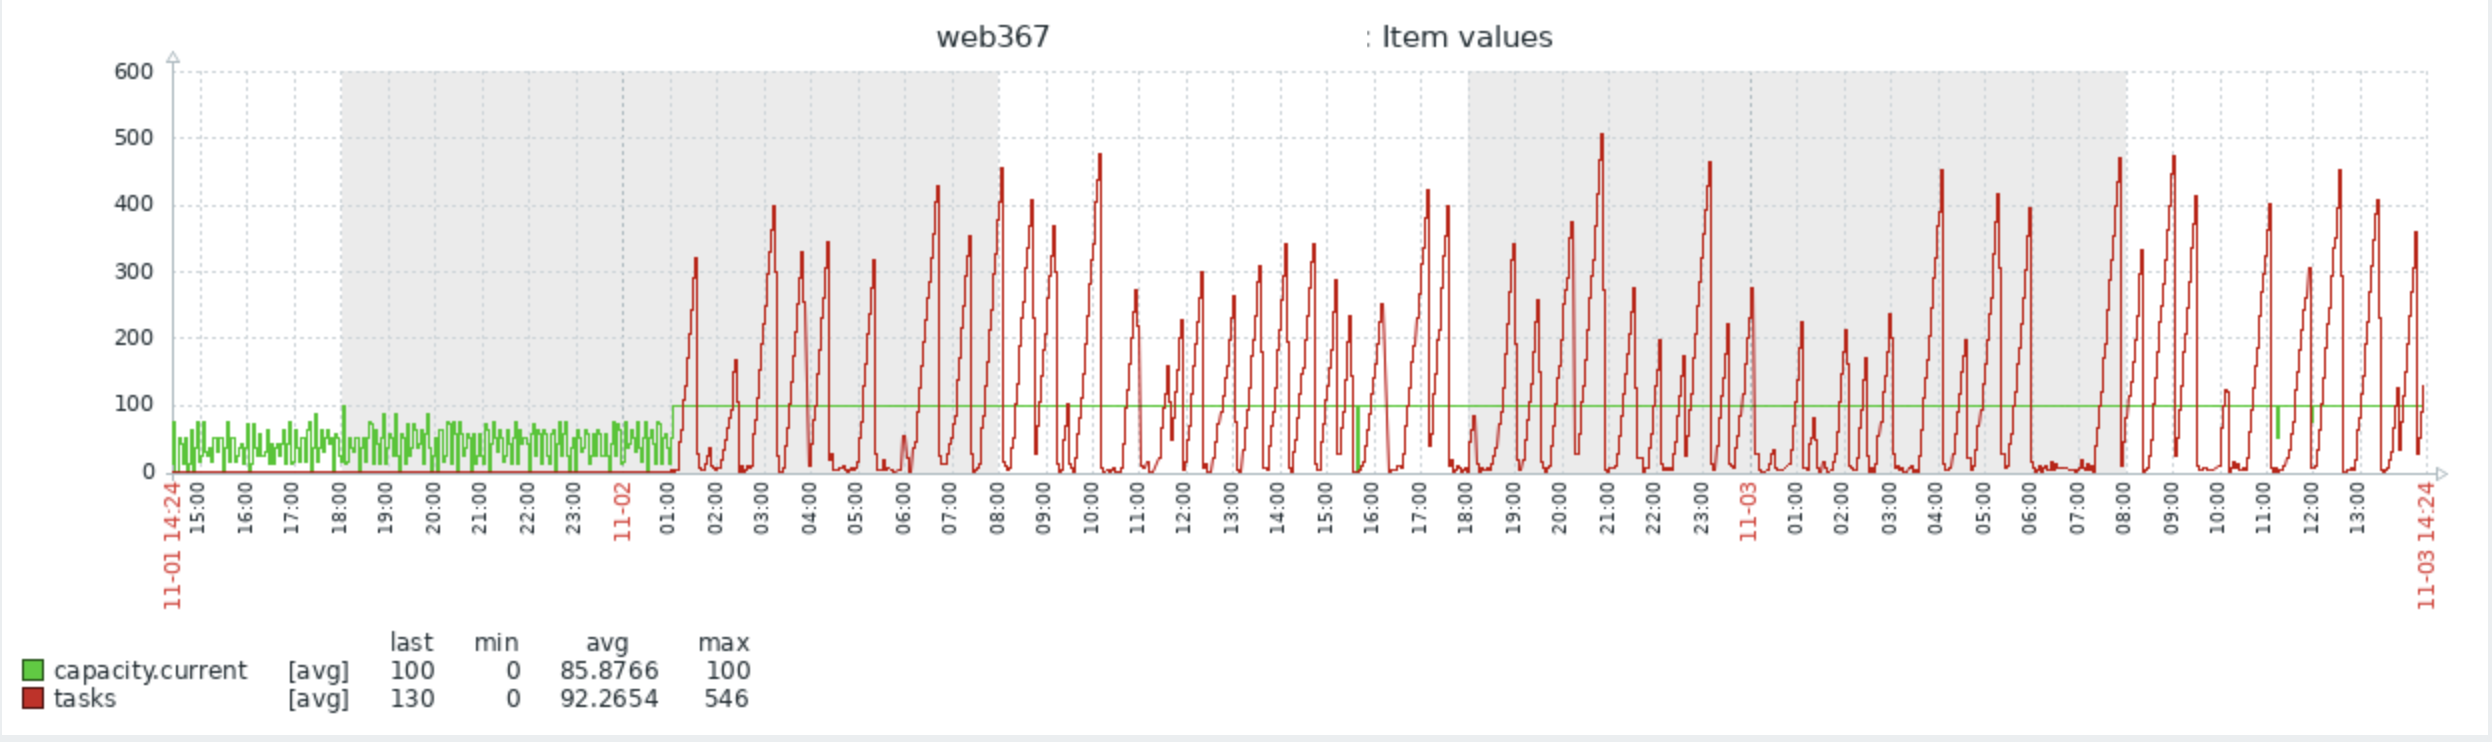
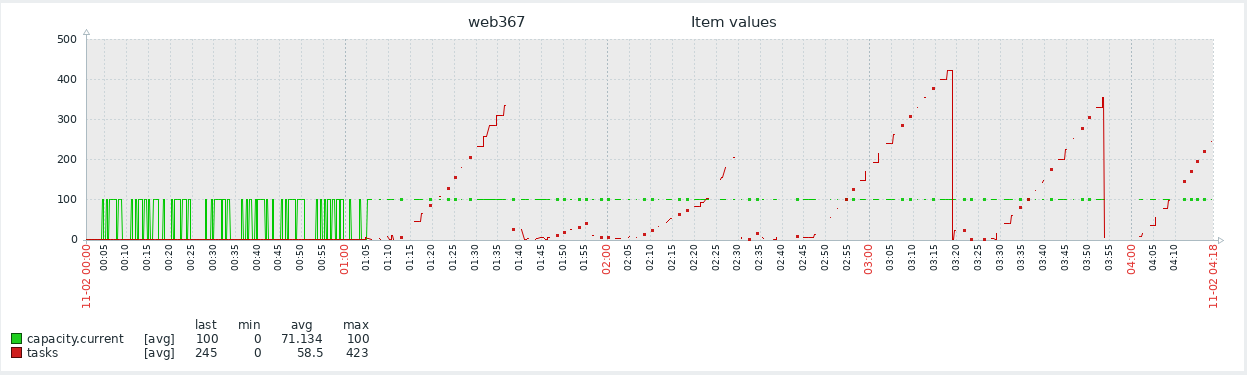
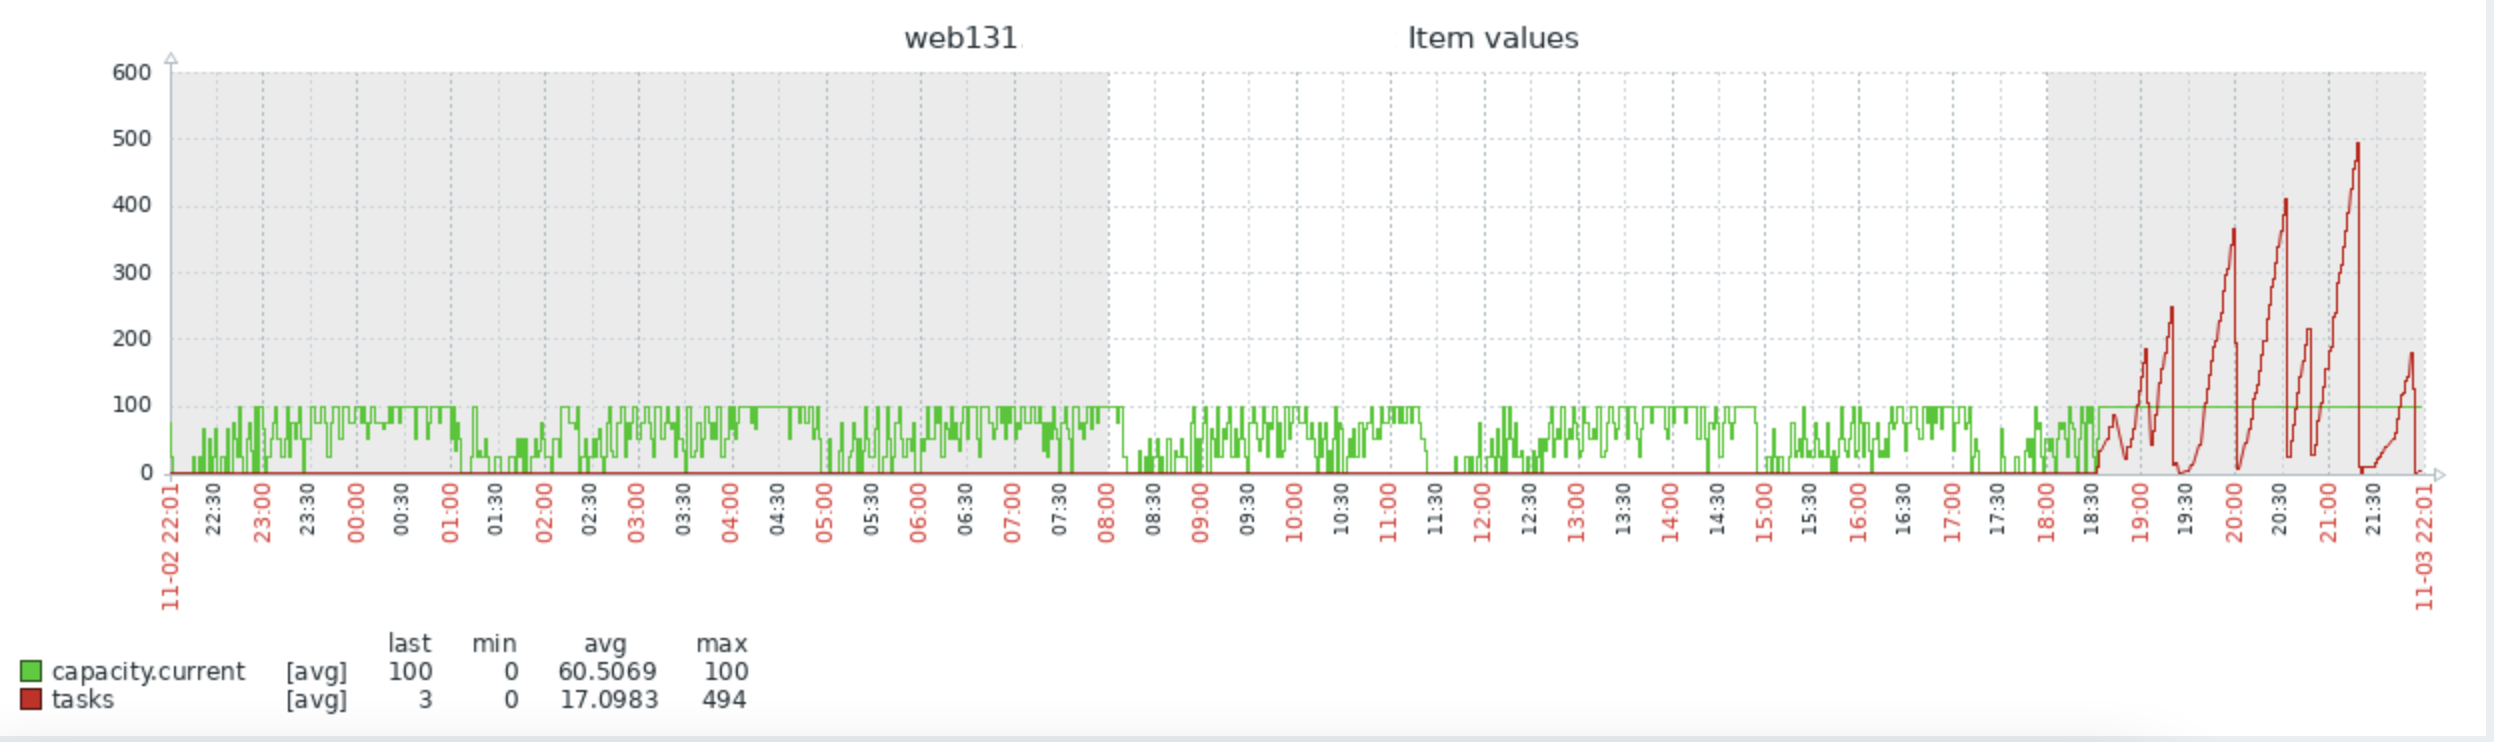
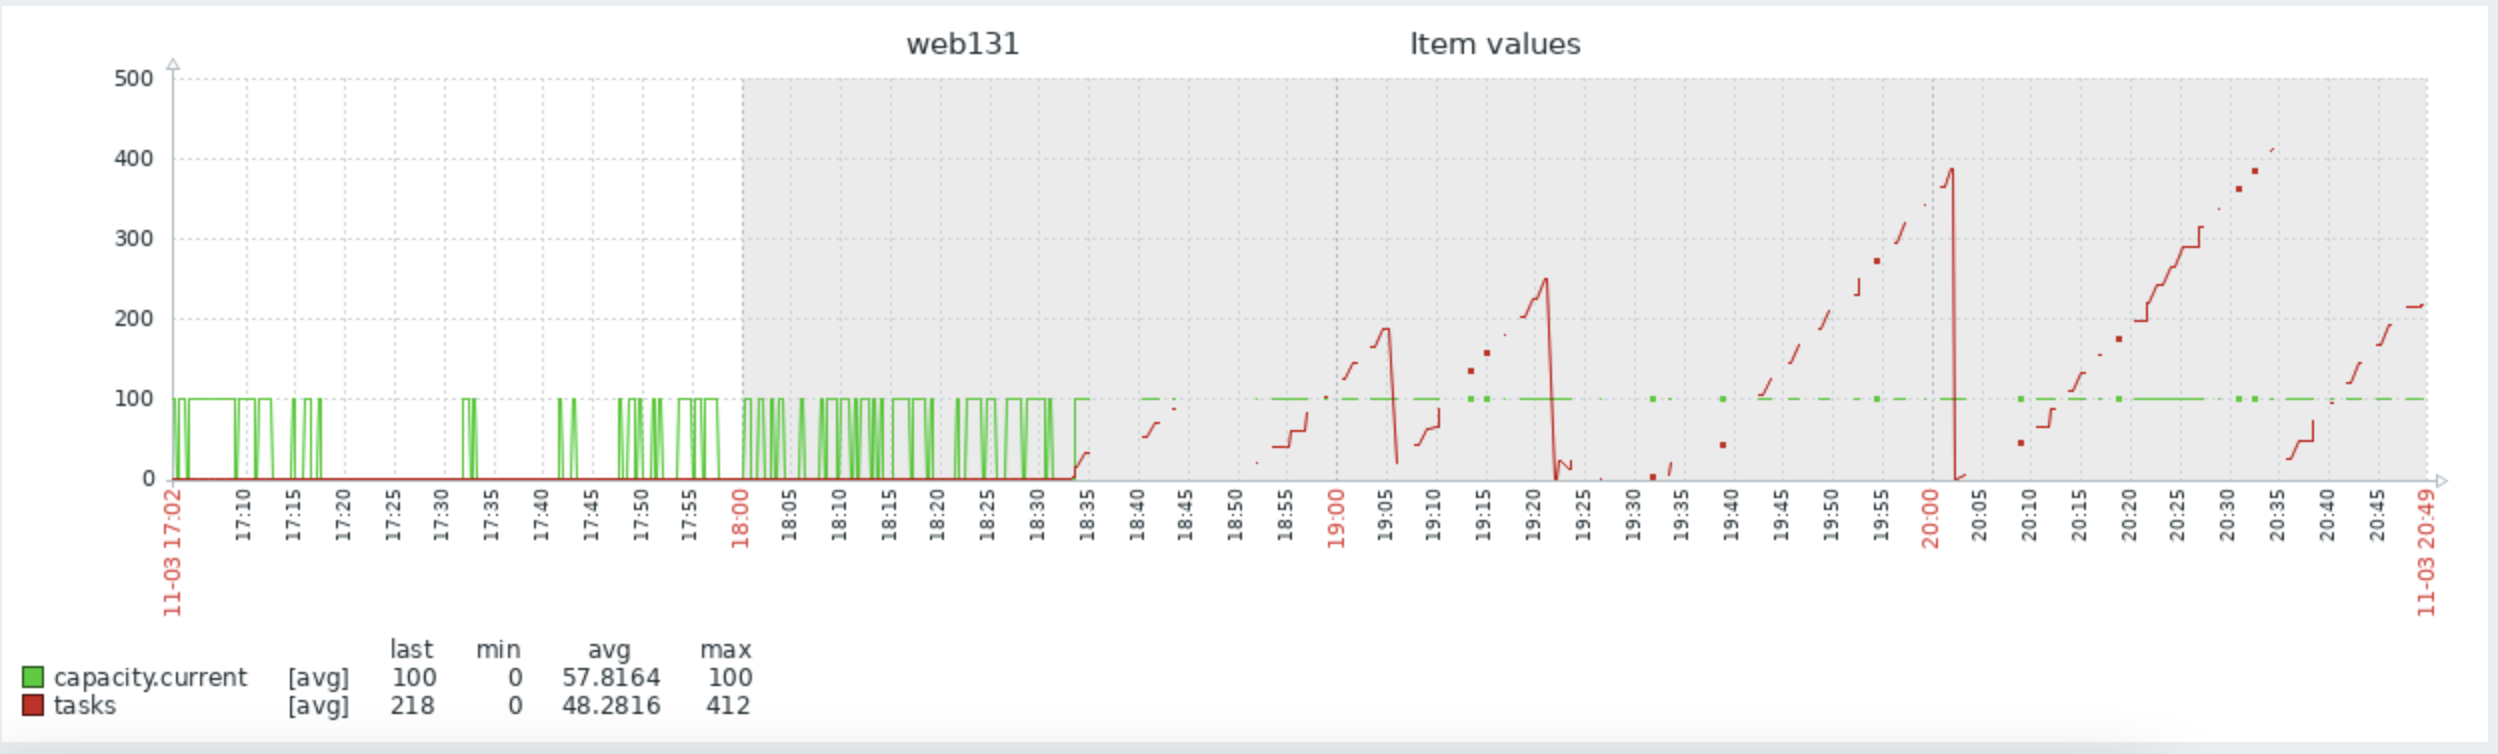
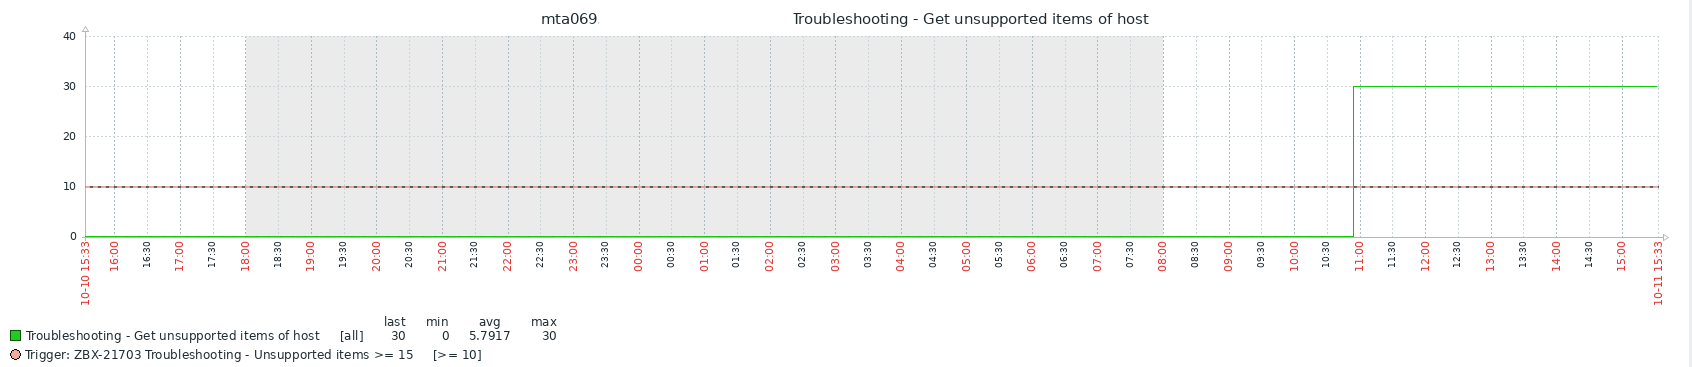
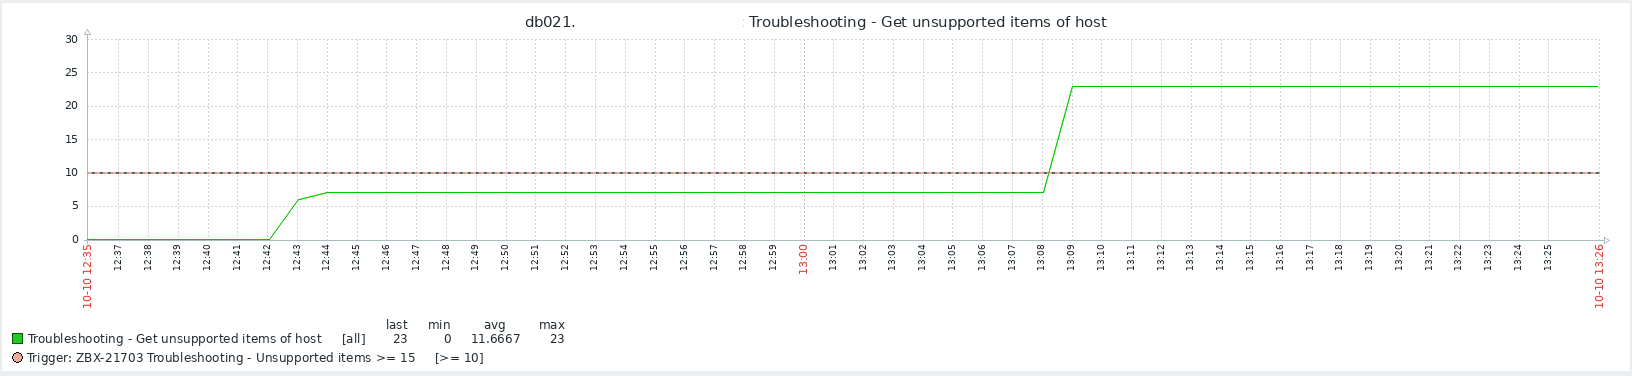
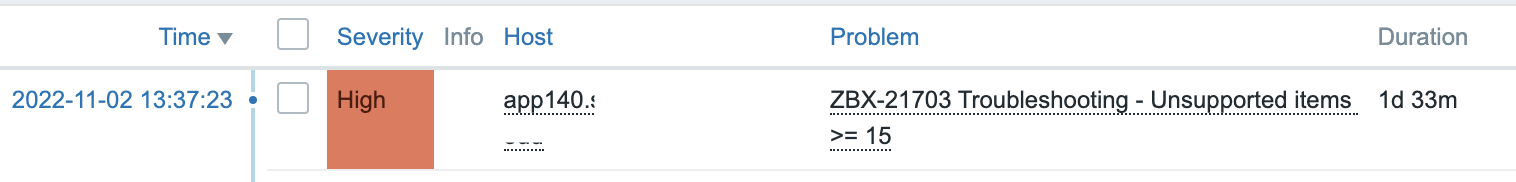
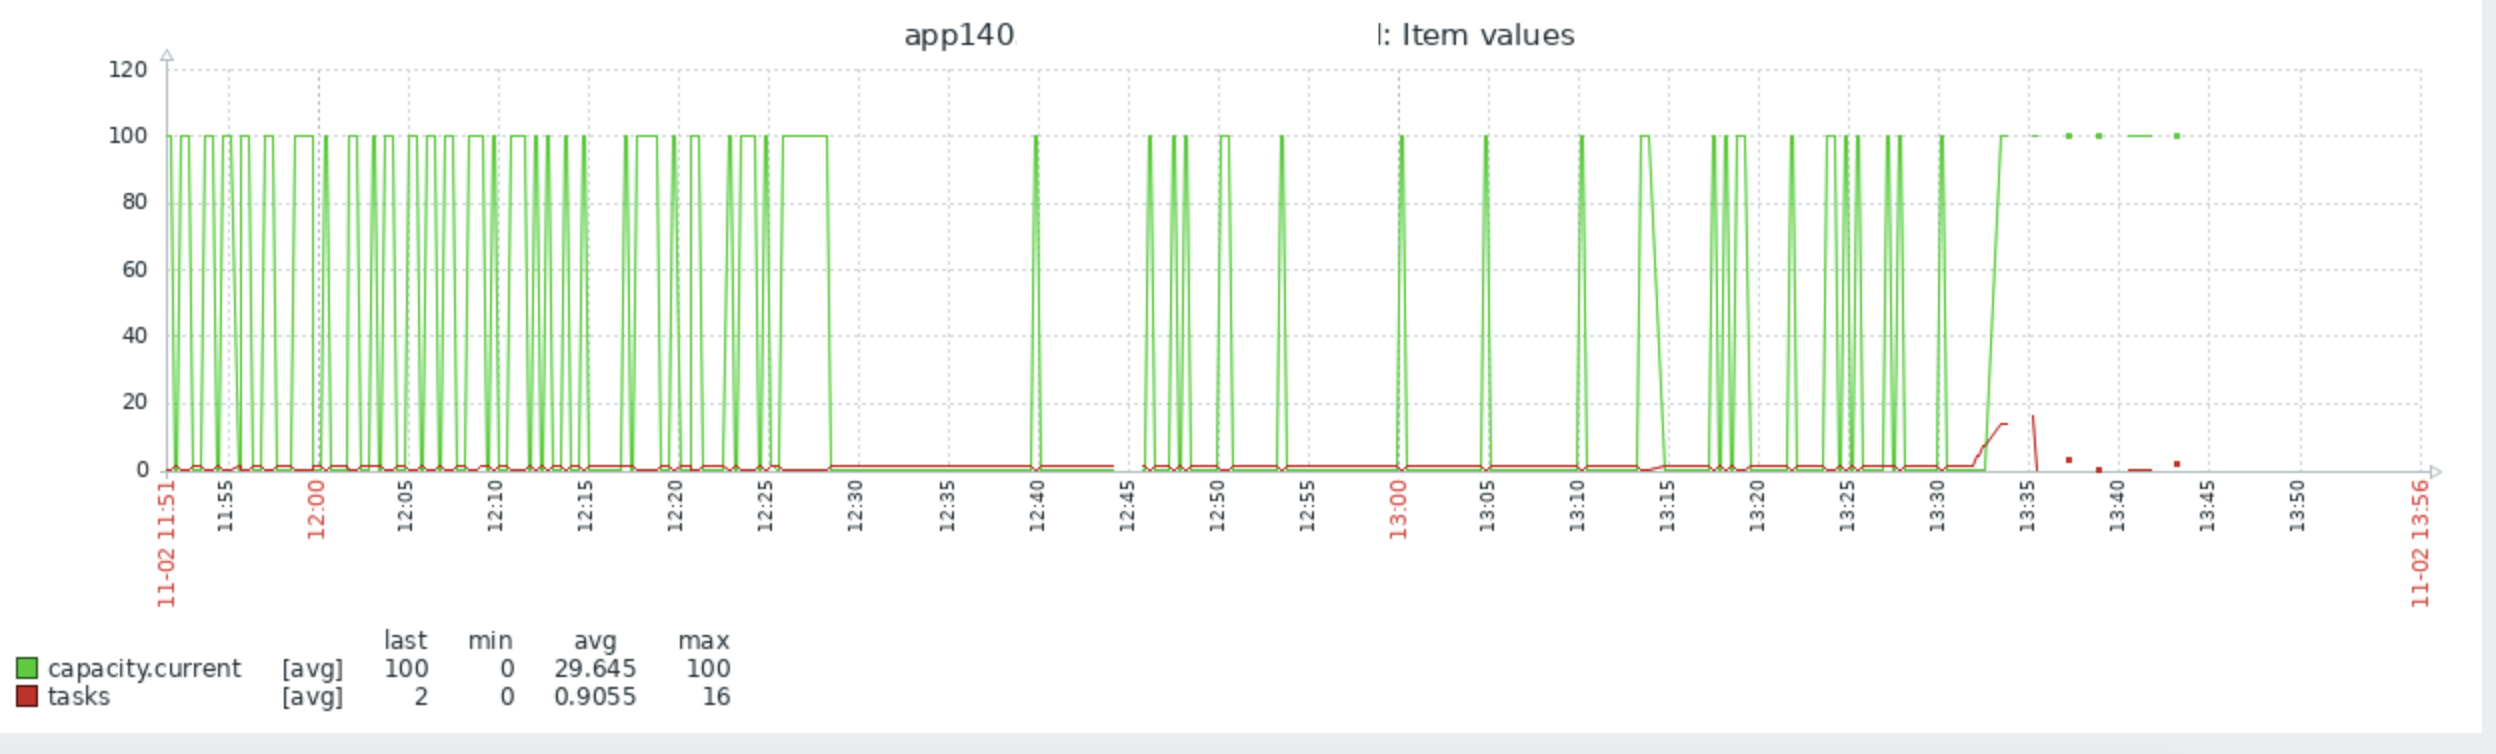
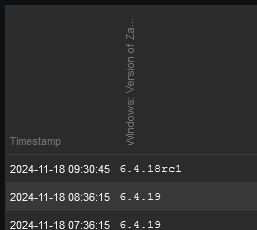
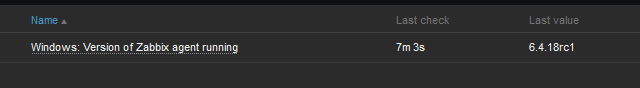
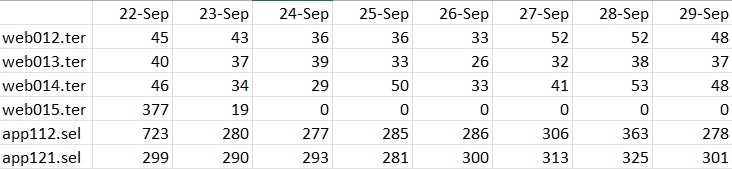
Zabbix agent2 availability for one of the impacted assets:

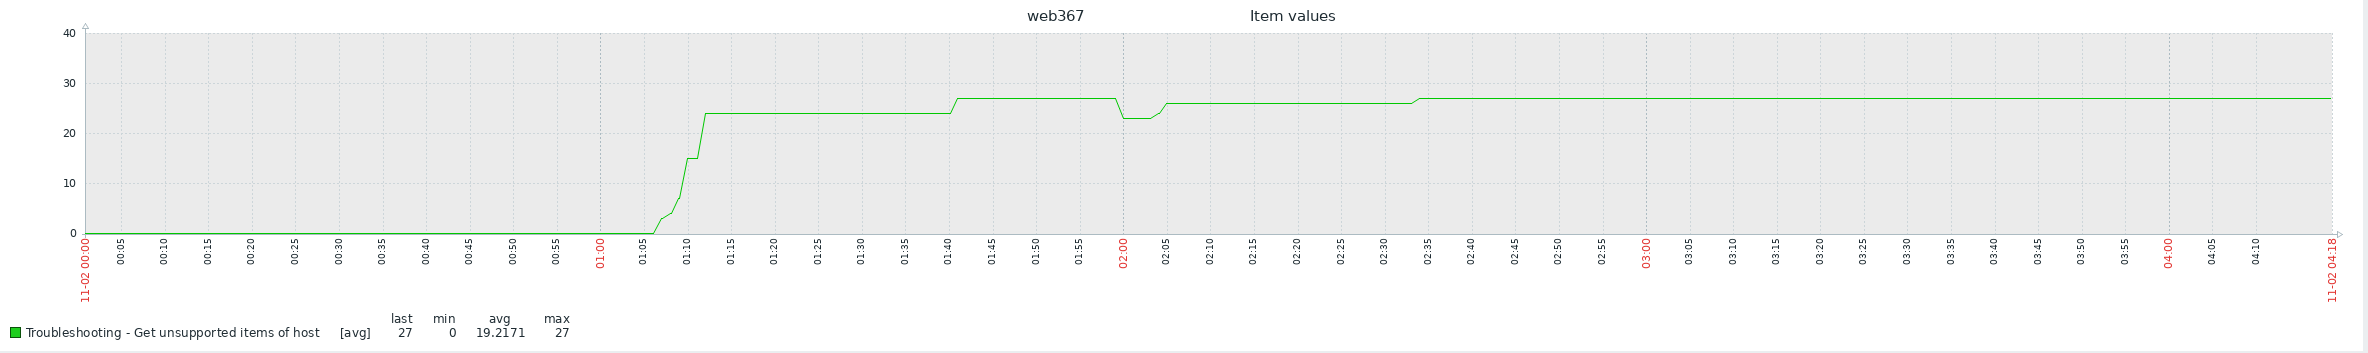
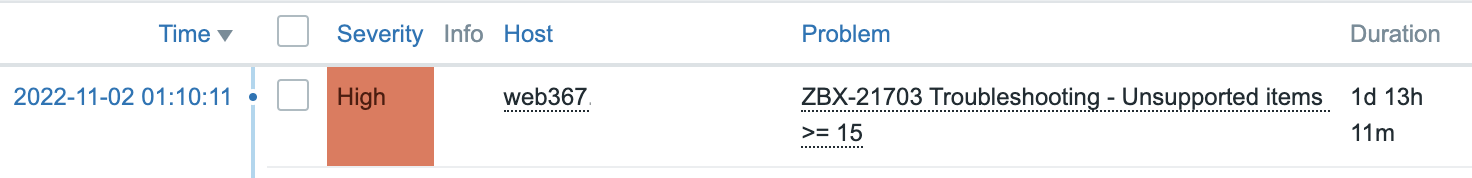
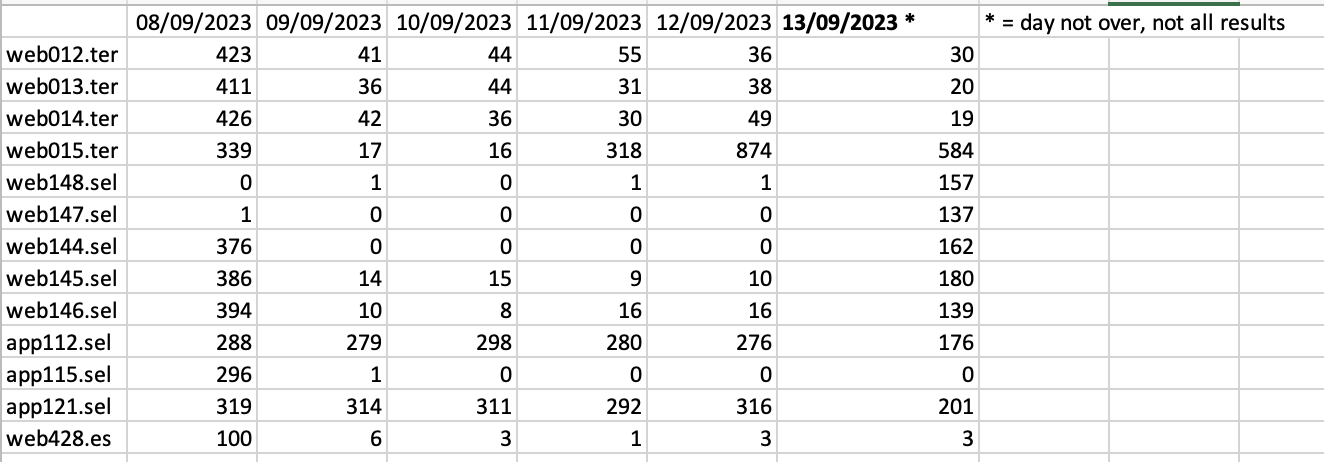
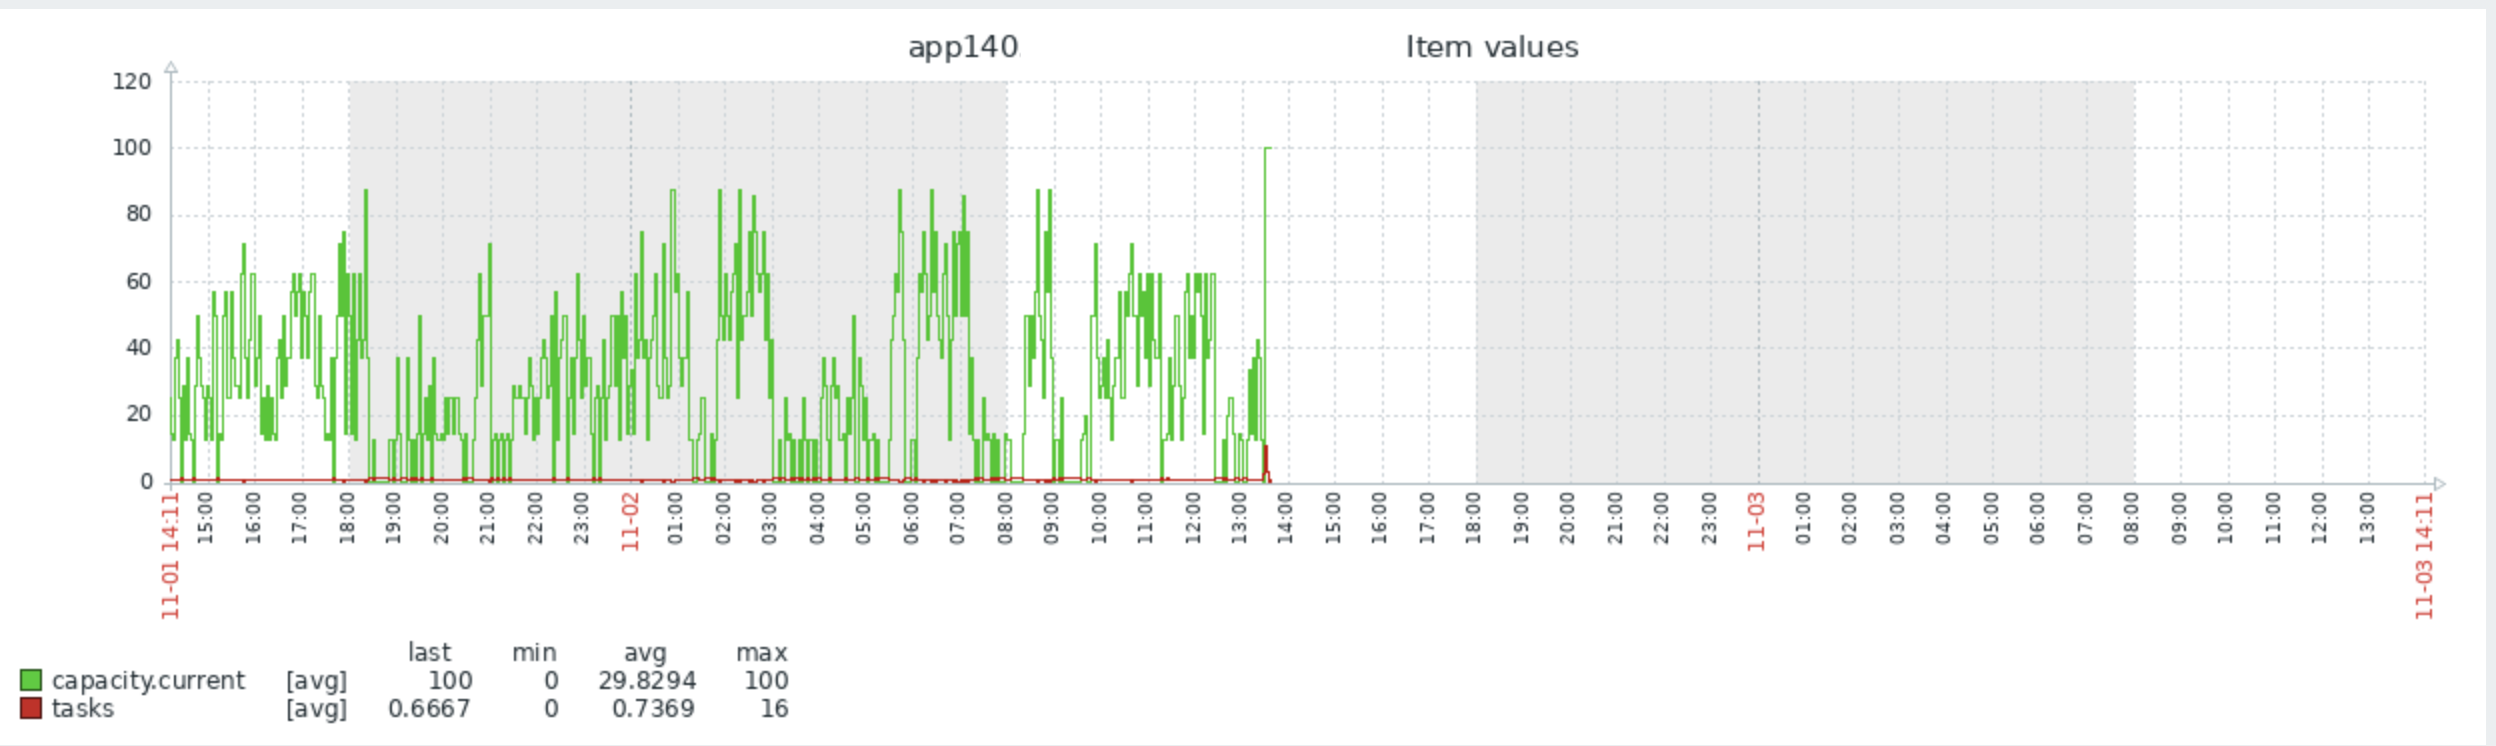
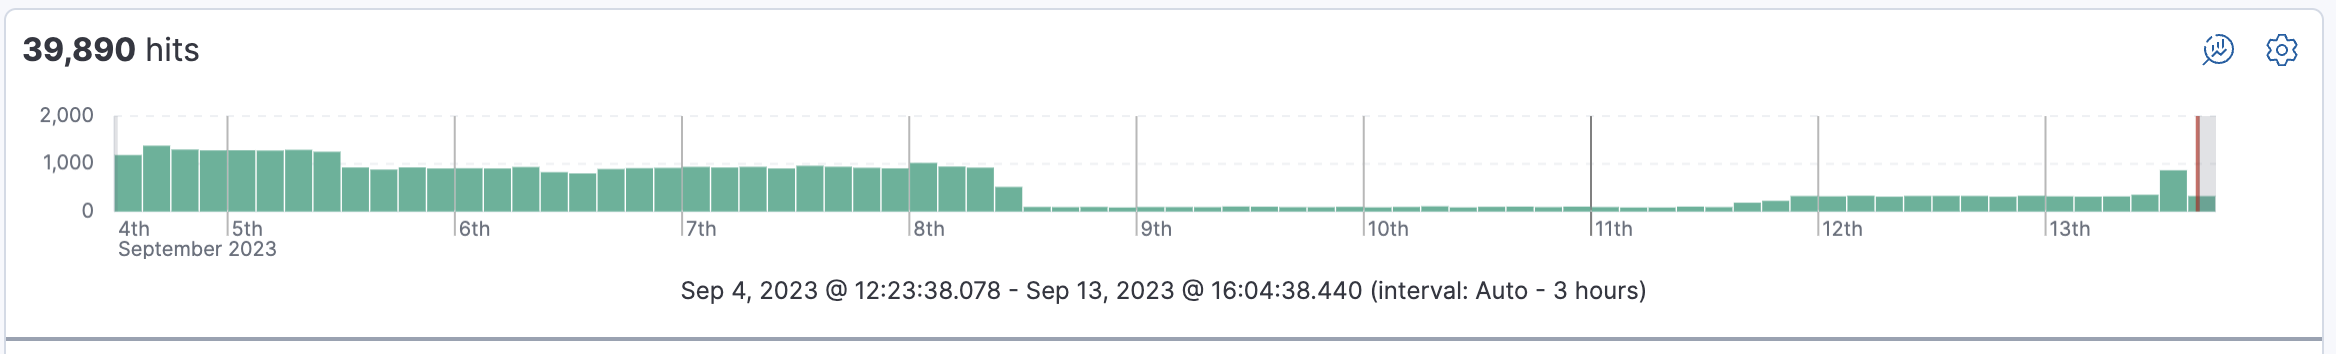
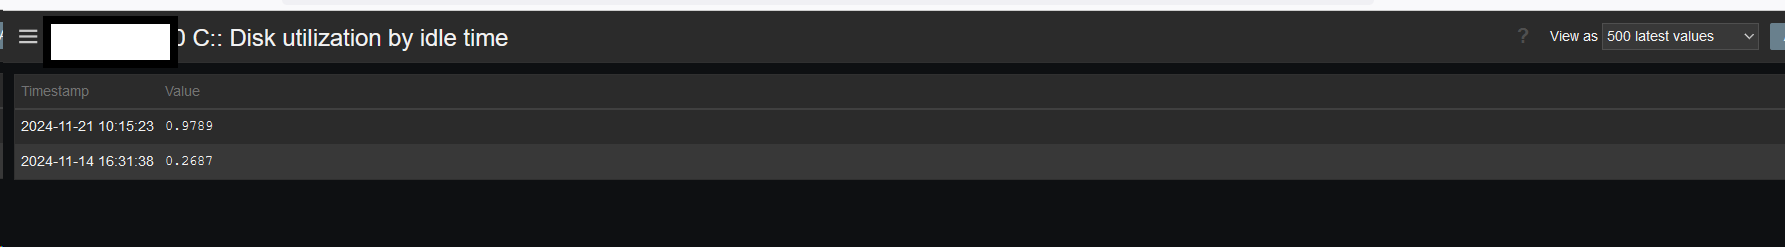
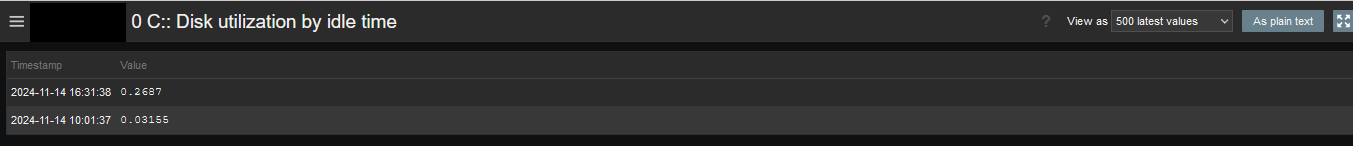
The issue results also in data gaps for items that are not using perf_counters:
Steps to reproduce:
We can't reproduce the issue. Troubleshooting so far:
Via Zabbix proxy towards an impacted asset – Not working:
root@proxy004:~# zabbix_get -s 10.10.10.10 -p 20050 -k 'perf_counter_en["\PhysicalDisk(0 C:)\Avg. Disk Write Queue Length",60]' --tls-connect psk --tls-psk-file /tmp/server-test01.psk --tls-psk-identity server-test01-agentZBX_NOTSUPPORTED: The system cannot find message text for message number 0x%1 in the message file for %2.
Via Zabbix proxy towards an impacted asset: system_run[] to get the same Perf Counter instead of using Zabbix build in function – This works:
root@proxy004:~# zabbix_get -s 10.10.10.10 -p 20050 -k 'system.run[powershell.exe "Get-Counter -Counter \"\PhysicalDisk(0 C:)\Avg. Disk Read Queue Length\""]' --tls-connect psk --tls-psk-file /tmp/server-test01.psk --tls-psk-identity server-test01-agent
Via powershell fetching counters locally on an impacted asset – this works:
PS C:\Program Files\Zabbix Agent 2> Get-Counter -Counter "\PhysicalDisk(0 C:)\Avg. Disk Read Queue Length"

Timestamp                 CounterSamples
---------                 --------------
28/09/2022 11:23:06       \\server-test01\physicaldisk(0 c:)\avg. disk read queue length :
                          0
Via Windows cmd fetching counters locally on impacted asset – this works:
C:\Program Files\Zabbix Agent 2>typeperf "\PhysicalDisk(0 C:)\Avg. Disk Read Queue Length"

"(PDH-CSV 4.0)","\\SERVER-TEST01\PhysicalDisk(0 C:)\Avg. Disk Read Queue Length"
"09/28/2022 11:33:18.382","0.000000"
"09/28/2022 11:33:19.385","0.000000"
"09/28/2022 11:33:20.386","0.000000"
"09/28/2022 11:33:21.392","0.000000"
"09/28/2022 11:33:22.395","0.000000"
"09/28/2022 11:33:23.398","0.000000"

The command completed successfully.
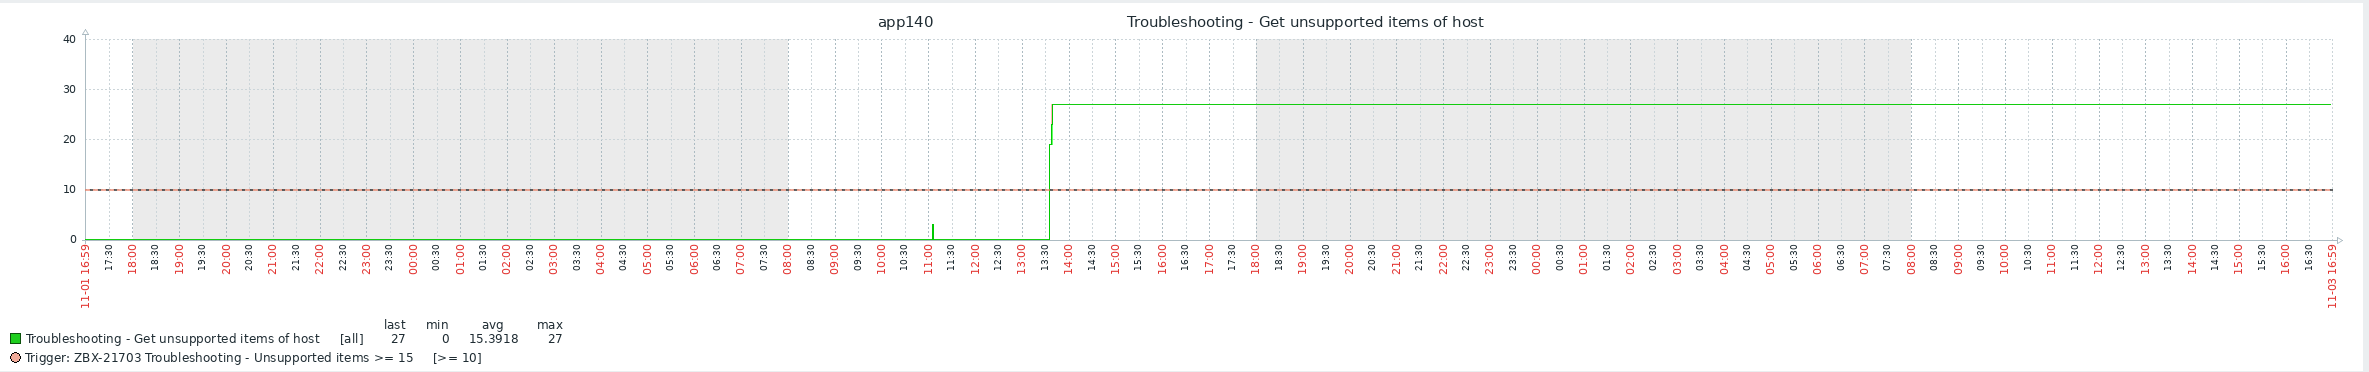
This issue is seen on all perf_counter and perf_counter_en, we’re only using the out of the box perf_counters of the Zabbix templates:
- perf_counter_en["\PhysicalDisk(0 C:)\Avg. Disk Write Queue Length",60]
- perf_counter_en["\PhysicalDisk(0 C:)\Current Disk Queue Length",60]
- perf_counter_en["\PhysicalDisk(0 C:)\Disk Reads/sec",60]
- perf_counter_en["\PhysicalDisk(0 C:)\Avg. Disk sec/Read",60]
- perf_counter_en["\PhysicalDisk(0 C:)\% Disk Time",60]
- perf_counter_en["\PhysicalDisk(0 C:)\Disk Writes/sec",60]
- perf_counter_en["\PhysicalDisk(0 C:)\Avg. Disk sec/Write",60]
- perf_counter_en["\PhysicalDisk(1 D:)\Avg. Disk Read Queue Length",60]
- perf_counter_en["\PhysicalDisk(1 D:)\Avg. Disk Write Queue Length",60]
- perf_counter_en["\PhysicalDisk(1 D:)\Current Disk Queue Length",60]
- perf_counter_en["\PhysicalDisk(1 D:)\Disk Reads/sec",60]
- perf_counter_en["\PhysicalDisk(1 D:)\Avg. Disk sec/Read",60]
- perf_counter_en["\PhysicalDisk(1 D:)\% Disk Time",60]
- perf_counter_en["\PhysicalDisk(1 D:)\Disk Writes/sec",60]
- perf_counter_en["\PhysicalDisk(1 D:)\Avg. Disk sec/Write",60]
- perf_counter_en["\Memory\Cache Bytes"]
- perf_counter_en["\System\Context Switches/sec"]
- perf_counter_en["\Processor Information(_total)\% DPC Time"]
- perf_counter_en["\Processor Information(_total)\% Interrupt Time"]
- perf_counter_en["\Processor Information(_total)\% Privileged Time"]
- perf_counter_en["\System\Processor Queue Length"]
- perf_counter_en["\Processor Information(_total)\% User Time"]
- perf_counter_en["\Memory\Free System Page Table Entries"]
- perf_counter_en["\Memory\Page Faults/sec"]
- perf_counter_en["\Memory\Pages/sec"]
- perf_counter_en["\Memory\Pool Nonpaged Bytes"]
- perf_counter_en["\System\Threads"]
- perf_counter_en["\Paging file(_Total)\% Usage"]
All performance counter queries are failing.
In attachment:
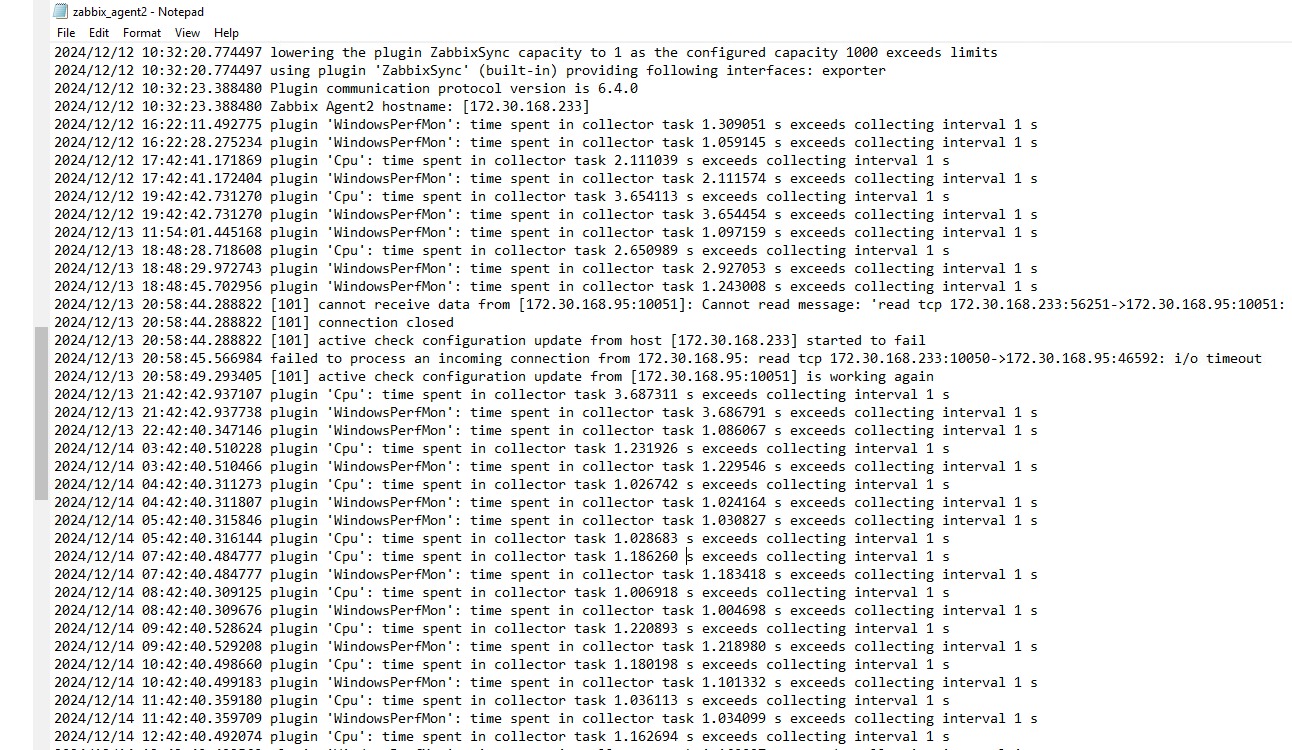
- log with debug level 5 of one of the impacted assets


- caused by
-
-

- Closed
-
- causes
-
ZBXNEXT-9024 Agents Capacity
-
- Closed
-
-
-

- Closed
-
- depends on
-
-

- Closed
-
-
ZBX-22366 Zabbix agent 2 crashes on Windows 2012
-
- Closed
-
-
-
- Closed
-
-
-
- Closed
-
- duplicates
-
-
- Confirmed
-
- is duplicated by
-
-
- Closed
-
-
-
- Closed
-
- part of
-
-

- Closed
-
- related to
-
-
- Closed
-
- mentioned in
-
Page Loading...
