-
Type:
Problem report
-
Resolution: Unresolved
-
Priority:
 Minor
Minor
-
None
-
Affects Version/s: 6.0.30
-
Component/s: Frontend (F)
-
None
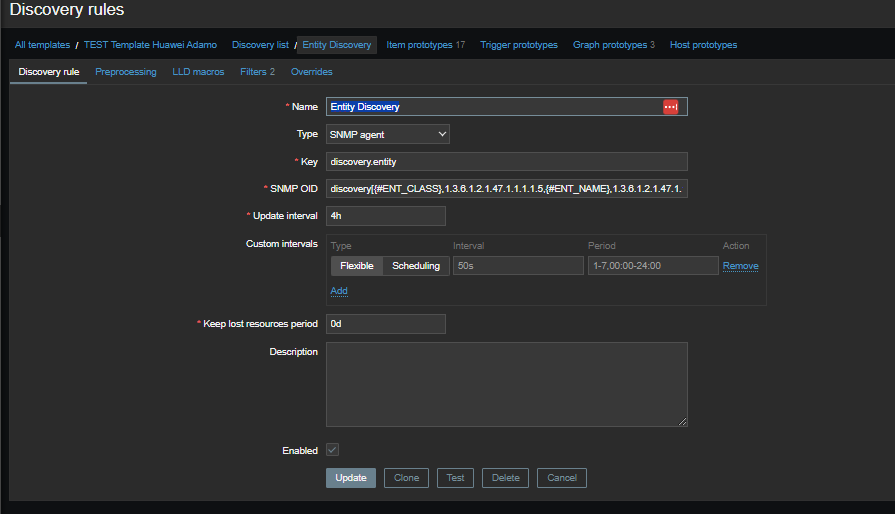
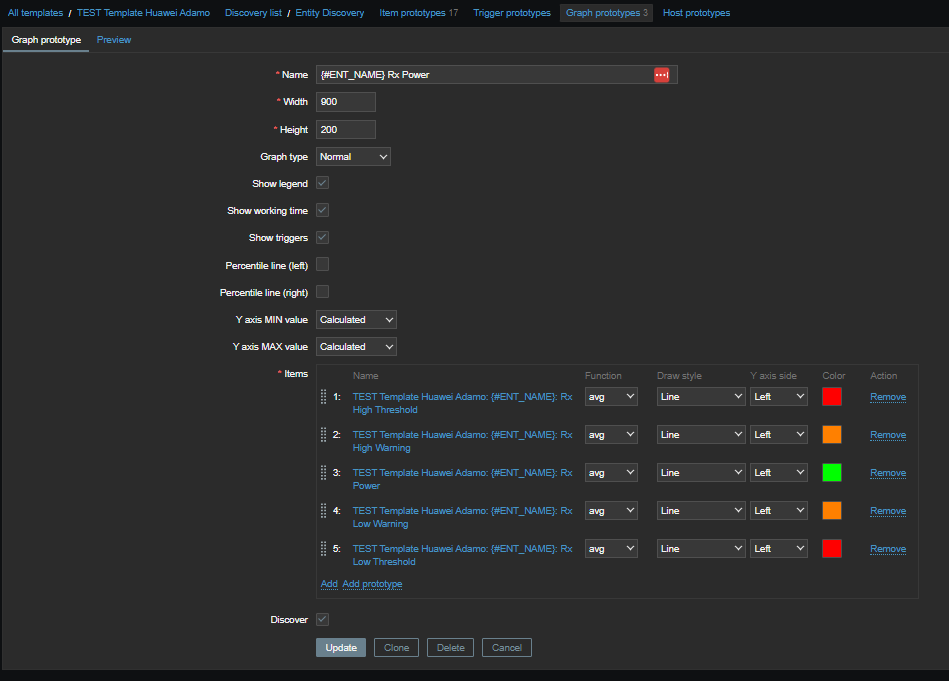
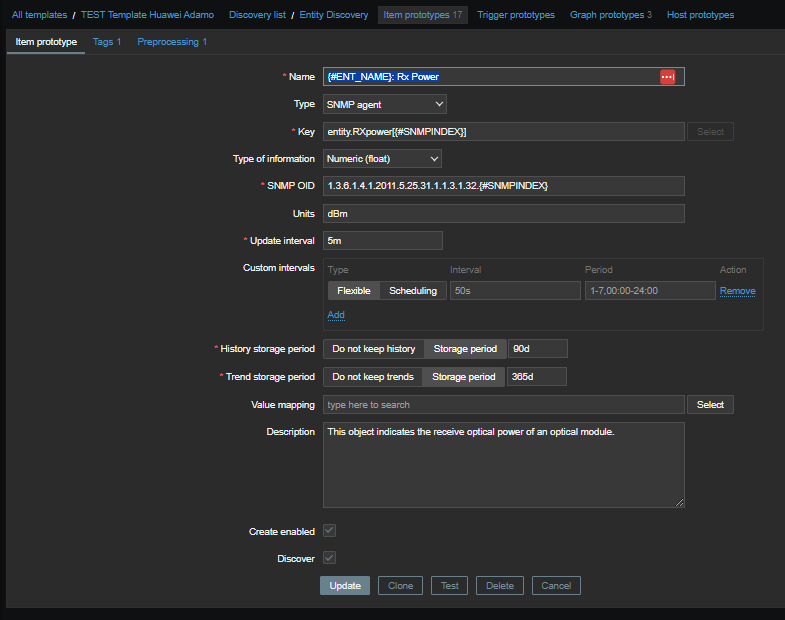
Steps to reproduce:
- It is unreproducible when adding graph manualy and providing manually the data. All looks good in such case. However strictly client's issue looks like a bug.
Clients version 6.0.22, my 6.4.14.
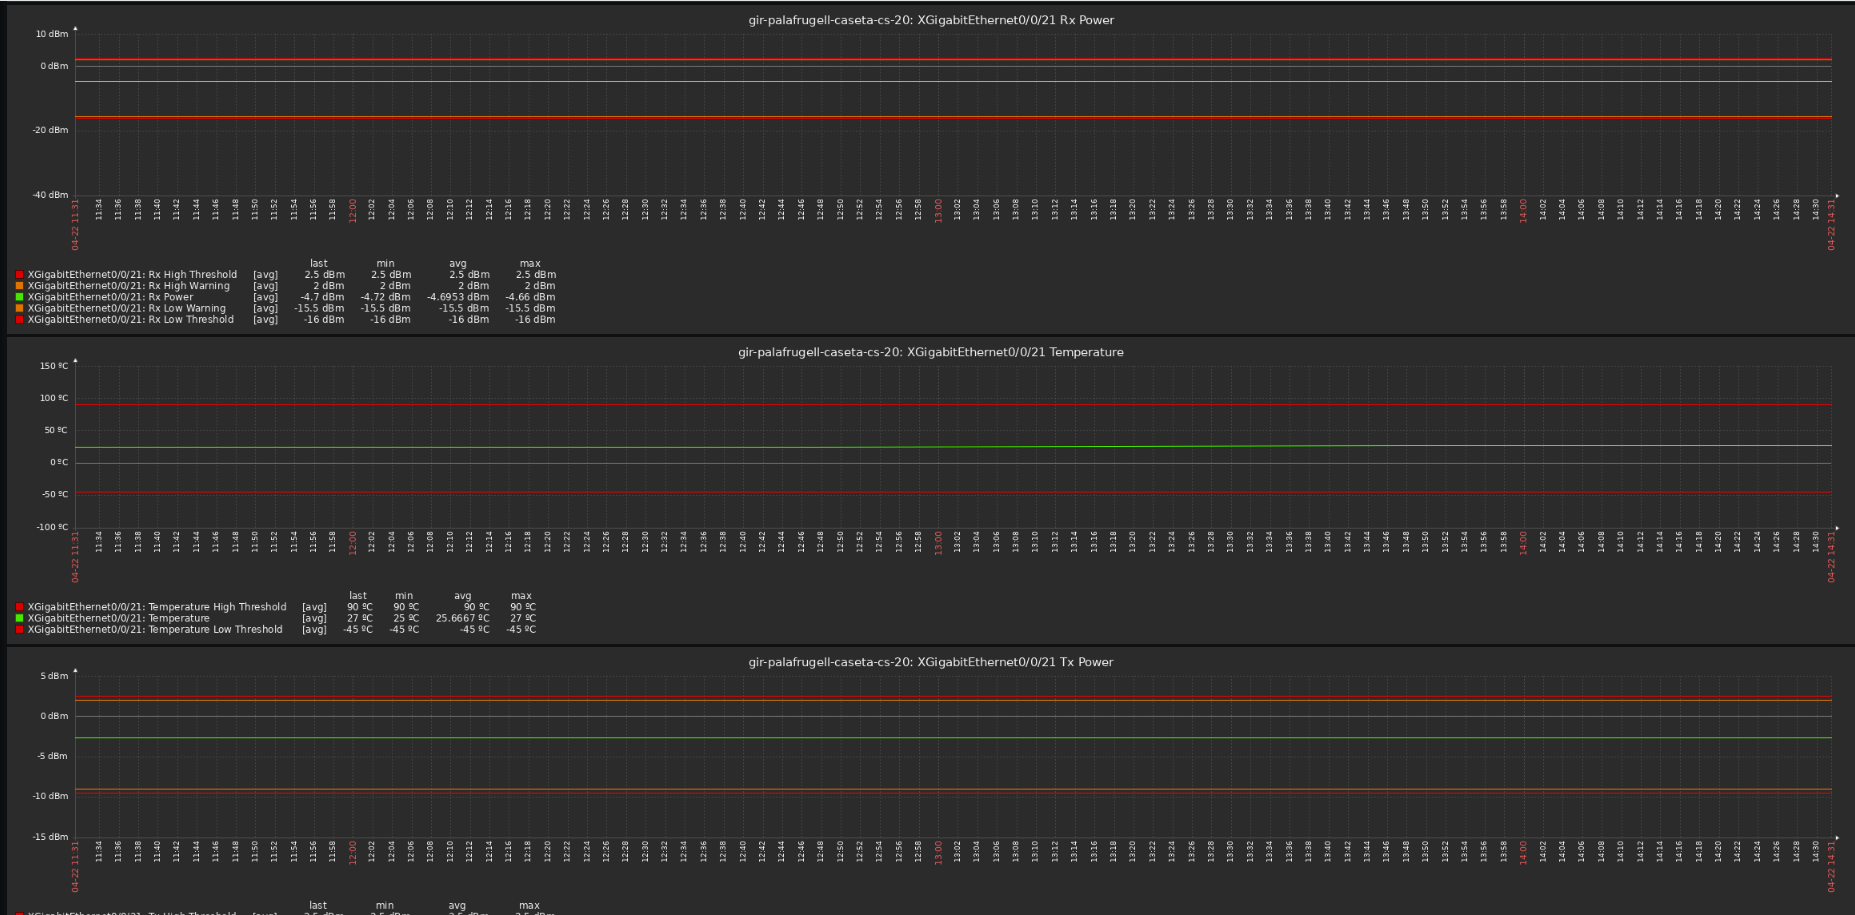
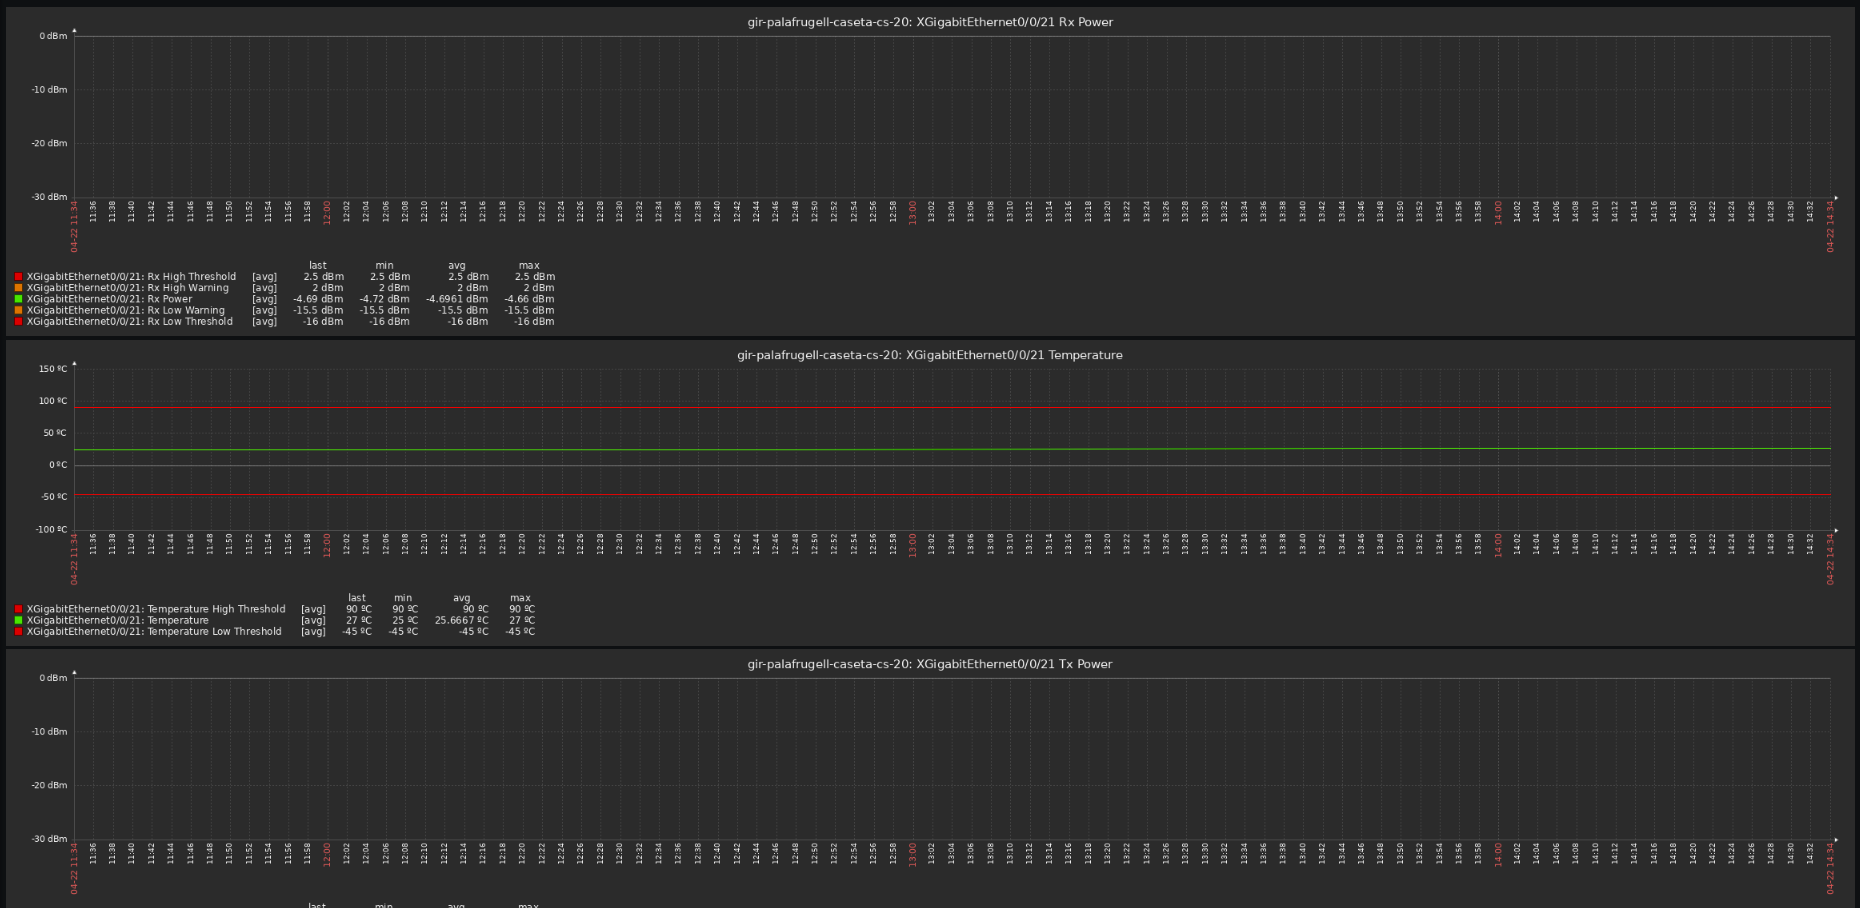
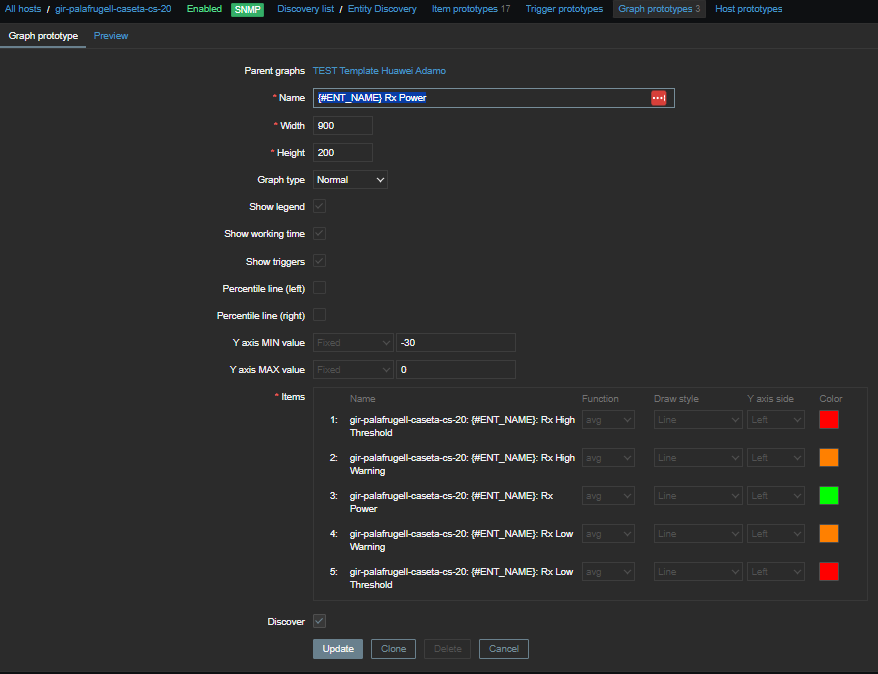
Result:
When setting the graph protoype y-axis to -30 to 0 units (calculated or fixed), the result graph is missing the graph line but provides accurate numerical data.
Providing debug data and screenshots.