Uploaded image for project: 'ZABBIX BUGS AND ISSUES'
  1. ZABBIX BUGS AND ISSUES
  2. ZBX-24811

zabbix7 web.page.get Monitoring item, stored data is truncated, resulting in abnormal trigger judgment and incorrect acquisition of complete data for judgment operation

XMLWordPrintable

    • Icon: Incident report Incident report
    • Resolution: Unresolved
    • Icon: Trivial Trivial
    • None
    • 7.0.0
    • None
    • None
    • Server OS :CentOS7.9 mysql8.0.36 php8.x nginx1.24
      client windows10 x64 chrome126

      复现步骤:

      Reproduction steps:

      新建模版,
      Create a new template,

      模版,创建监控项,键值
      Template, create monitoring items, key values

      web.page.get[http://{HOST.NAME}] 

      类型HTTP代理,

      Type HTTP proxy,

      模版,创建触发器,表达式  

      Template, create trigger, expression

      find(/jquery/web.page.get[http://{HOST.NAME}],,,"友情链接")=0 

      主机名为www.58408.com,主机应用模版,查看最新数据,就可以复现这个问题.

      The host name is www.58408.com , and the host application template can be used to reproduce this issue by checking the latest data

      www.58408.com 

      问题是:

      problem is :

      zabbix_get -s 8.8.8.8 -p 10050 -k web.page.get[https://www.58408.com ]
      zabbix_agentd -t web.page.get[https://www.58408.com ] 

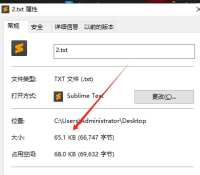
      这2种测试方法,目标都返回了完整的,超过64K长度的内容,但是在储存到数据库之前,被截断为64K了

      Both of these testing methods returned complete content exceeding 64K in length, but it was truncated to 64K before being stored in the database

      查看了以下文档,均未找到解决方法

      I have reviewed the following documents and have not found a solution

      https://support.zabbix.com/browse/ZBX-16558
      https://support.zabbix.com/browse/ZBX-11117
      https://support.zabbix.com/browse/ZBX-6590
      https://support.zabbix.com/browse/ZBXNEXT-6109
      https://www.zabbix.com/documentation/current/en/manual/config/items/item#text_data_limits

      已设置表history_text的字段value类型为longtext了.
      The value type of the field in table history_text has been set to longtext

      CREATE TABLE `history_text` (
        `itemid` bigint unsigned NOT NULL,
        `clock` int NOT NULL DEFAULT '0',
        `value` longtext CHARACTER SET utf8mb4 COLLATE utf8mb4_bin NOT NULL,
        `ns` int NOT NULL DEFAULT '0',
        PRIMARY KEY (`itemid`,`clock`,`ns`)
      ) ENGINE=InnoDB DEFAULT CHARSET=utf8mb4 COLLATE=utf8mb4_bin; 

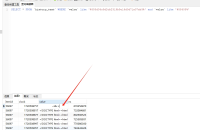
      但是查看最新监控项储存的数据,还是被截断为64K了,请帮帮我,我需要解决这个问题 However, when checking the data stored in the latest monitoring items, it has still been truncated to 64K. Please help me, I need to solve this problem
        1. 模版监控项.png
          模版监控项.png
          191 kB
        2. 模版.png
          模版.png
          127 kB
        3. 数据库数据体积.png
          数据库数据体积.png
          45 kB
        4. 数据库储存的被截断的数据.png
          数据库储存的被截断的数据.png
          110 kB
        5. 主机触发器.png
          主机触发器.png
          555 kB
        6. 主机监控项.png
          主机监控项.png
          384 kB
        7. 主机的最新数据.png
          主机的最新数据.png
          269 kB
        8. 主机的,测试监控项测试结果.png
          主机的,测试监控项测试结果.png
          435 kB
        9. html.txt
          65 kB

            azyla Arkadiusz Zyla
            c32 c32
            Votes:
            0 Vote for this issue
            Watchers:
            2 Start watching this issue

              Created:
              Updated:

                Estimated:
                Original Estimate - 24h
                24h
                Remaining:
                Remaining Estimate - 24h
                24h
                Logged:
                Time Spent - Not Specified
                Not Specified