-
Type:
Incident report
-
Resolution: Fixed
-
Priority:
 Trivial
-
None
-
Affects Version/s: 7.0.0
-
Component/s: None
-
None
-
Environment:Server OS :CentOS7.9 mysql8.0.36 php8.x nginx1.24
client windows10 x64 chrome126
Reproduction steps:
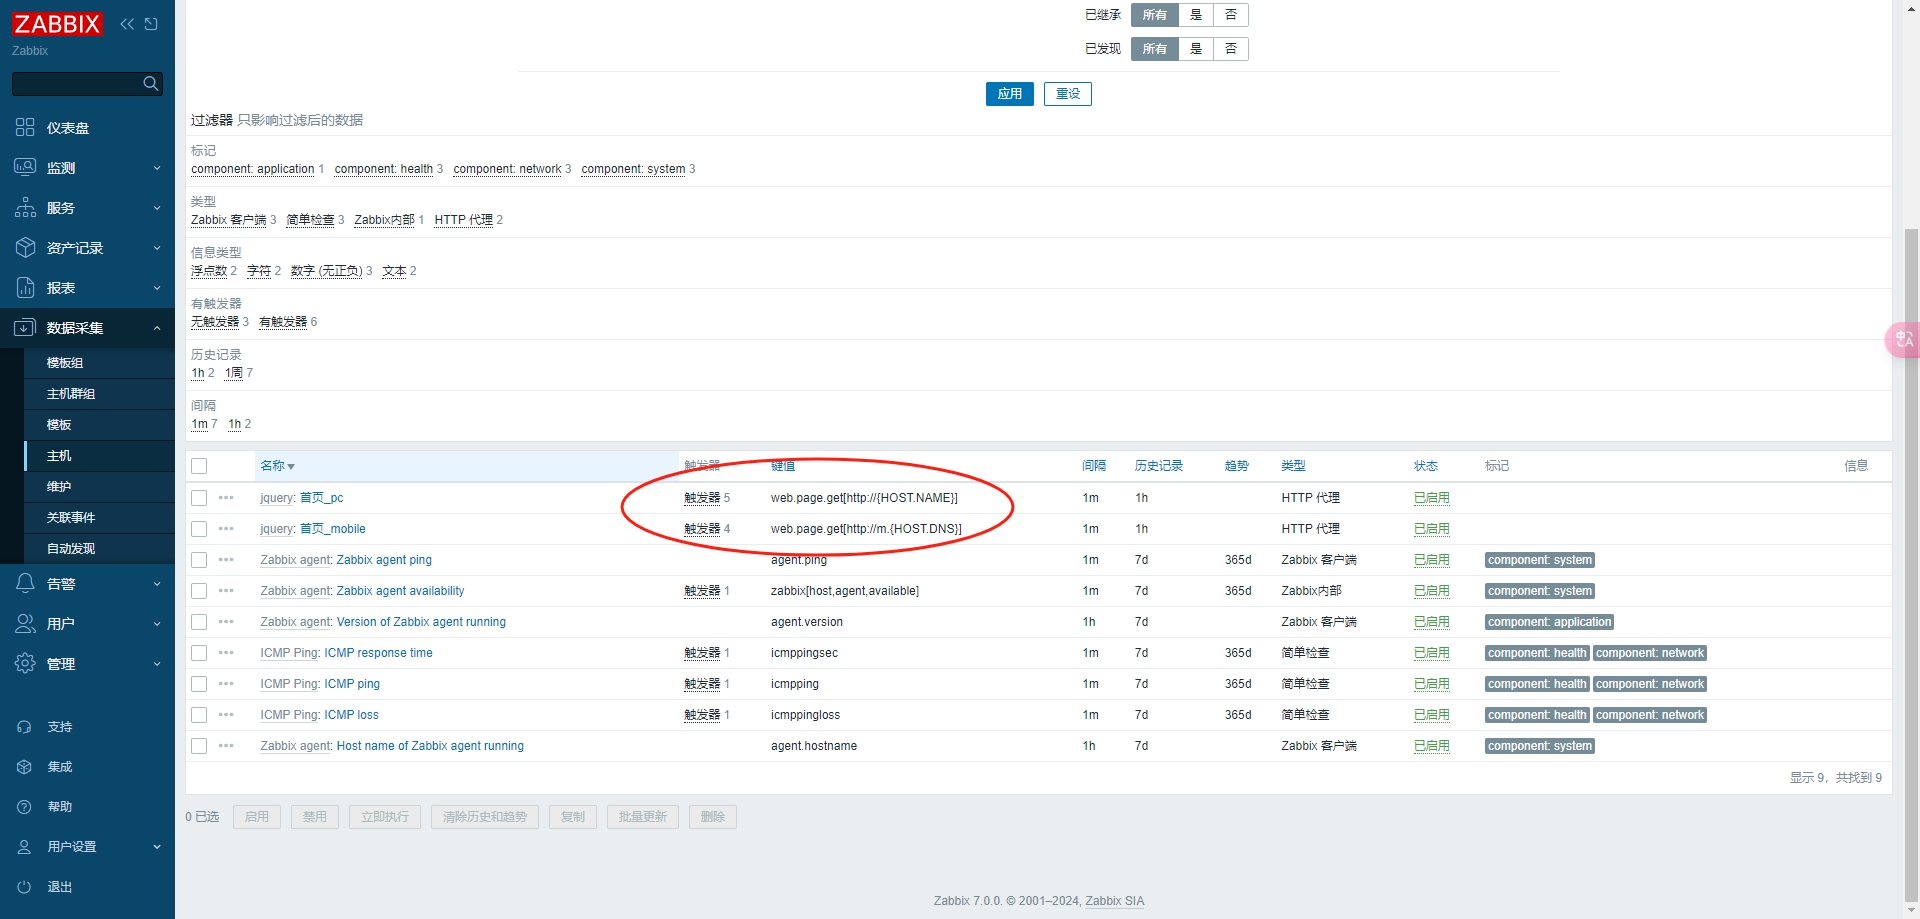
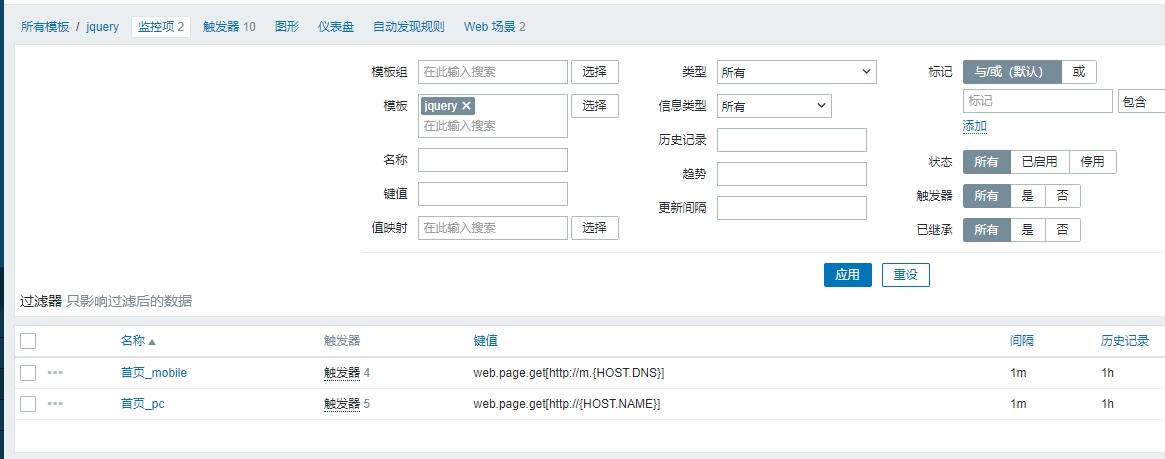
Create a new template,
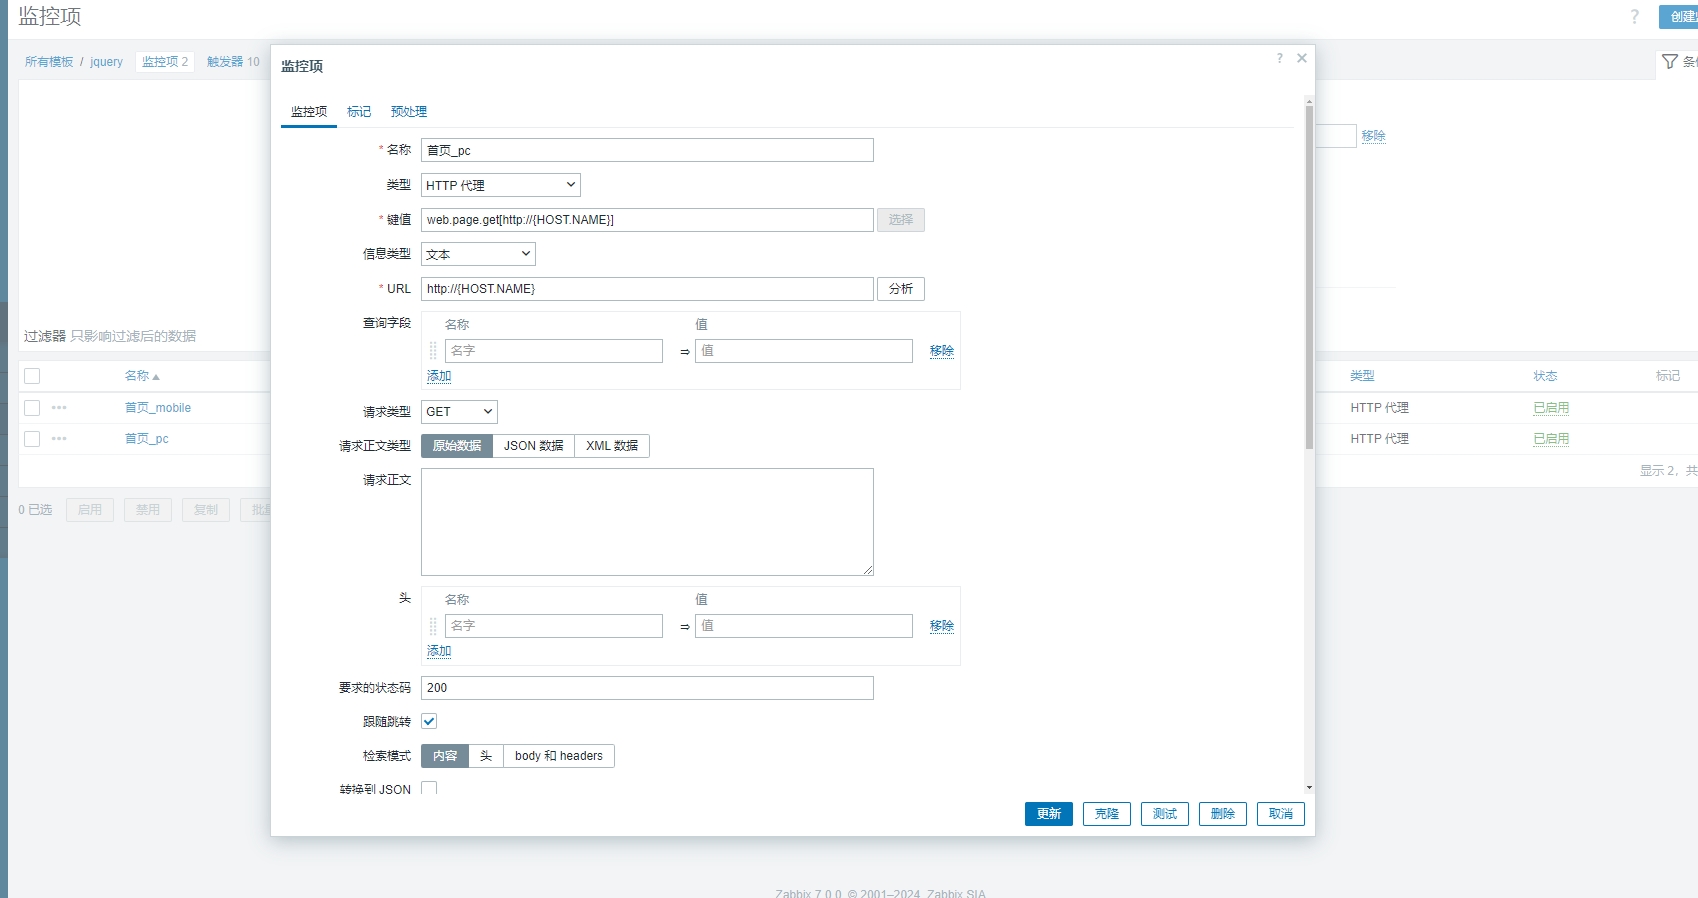
Template, create monitoring items, key values
web.page.get[http://{HOST.NAME}]
Type HTTP proxy,
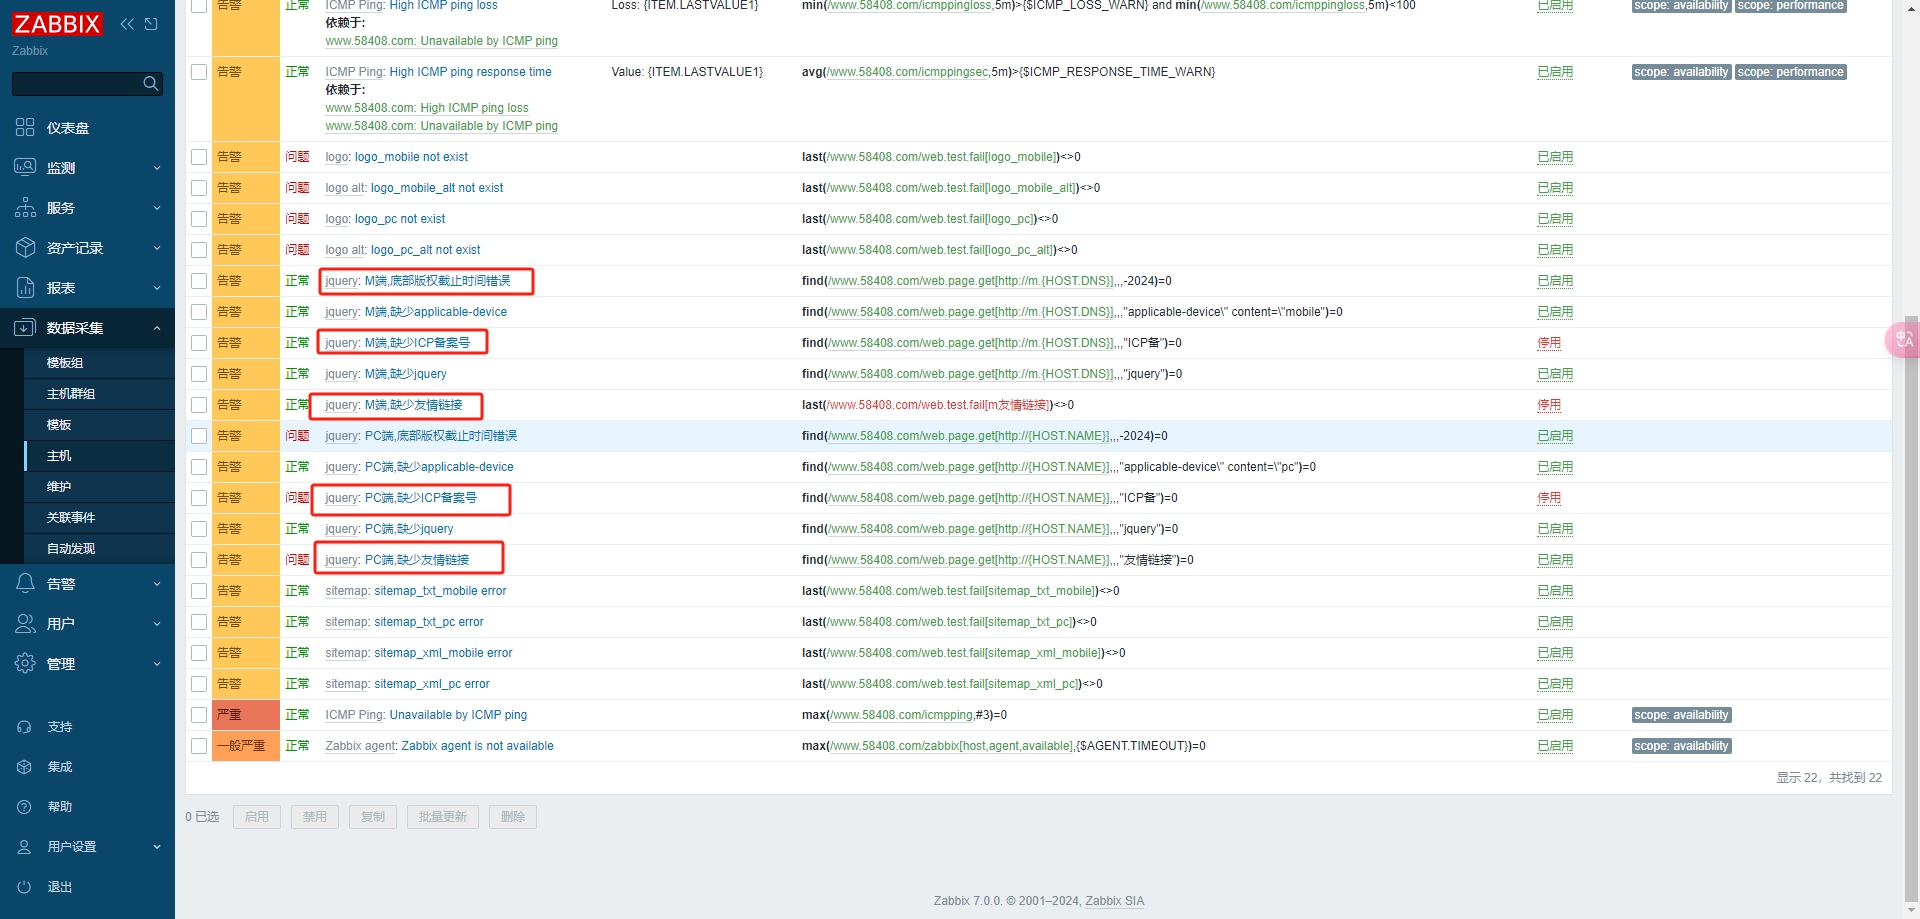
Template, create trigger, expression
find(/jquery/web.page.get[http://{HOST.NAME}],,,"友情链接")=0
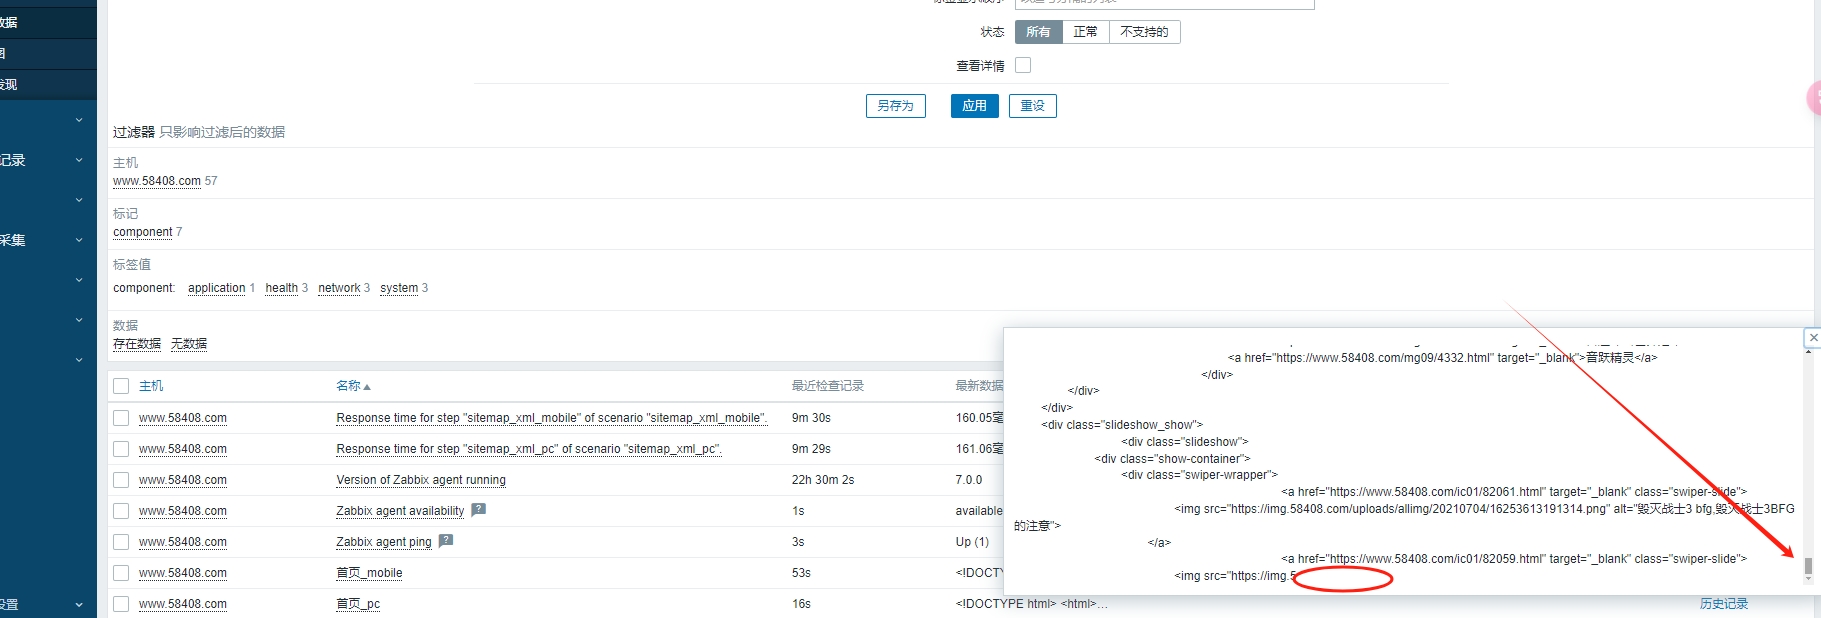
The host name is www.58408.com , and the host application template can be used to reproduce this issue by checking the latest data
www.58408.com
The problem is :
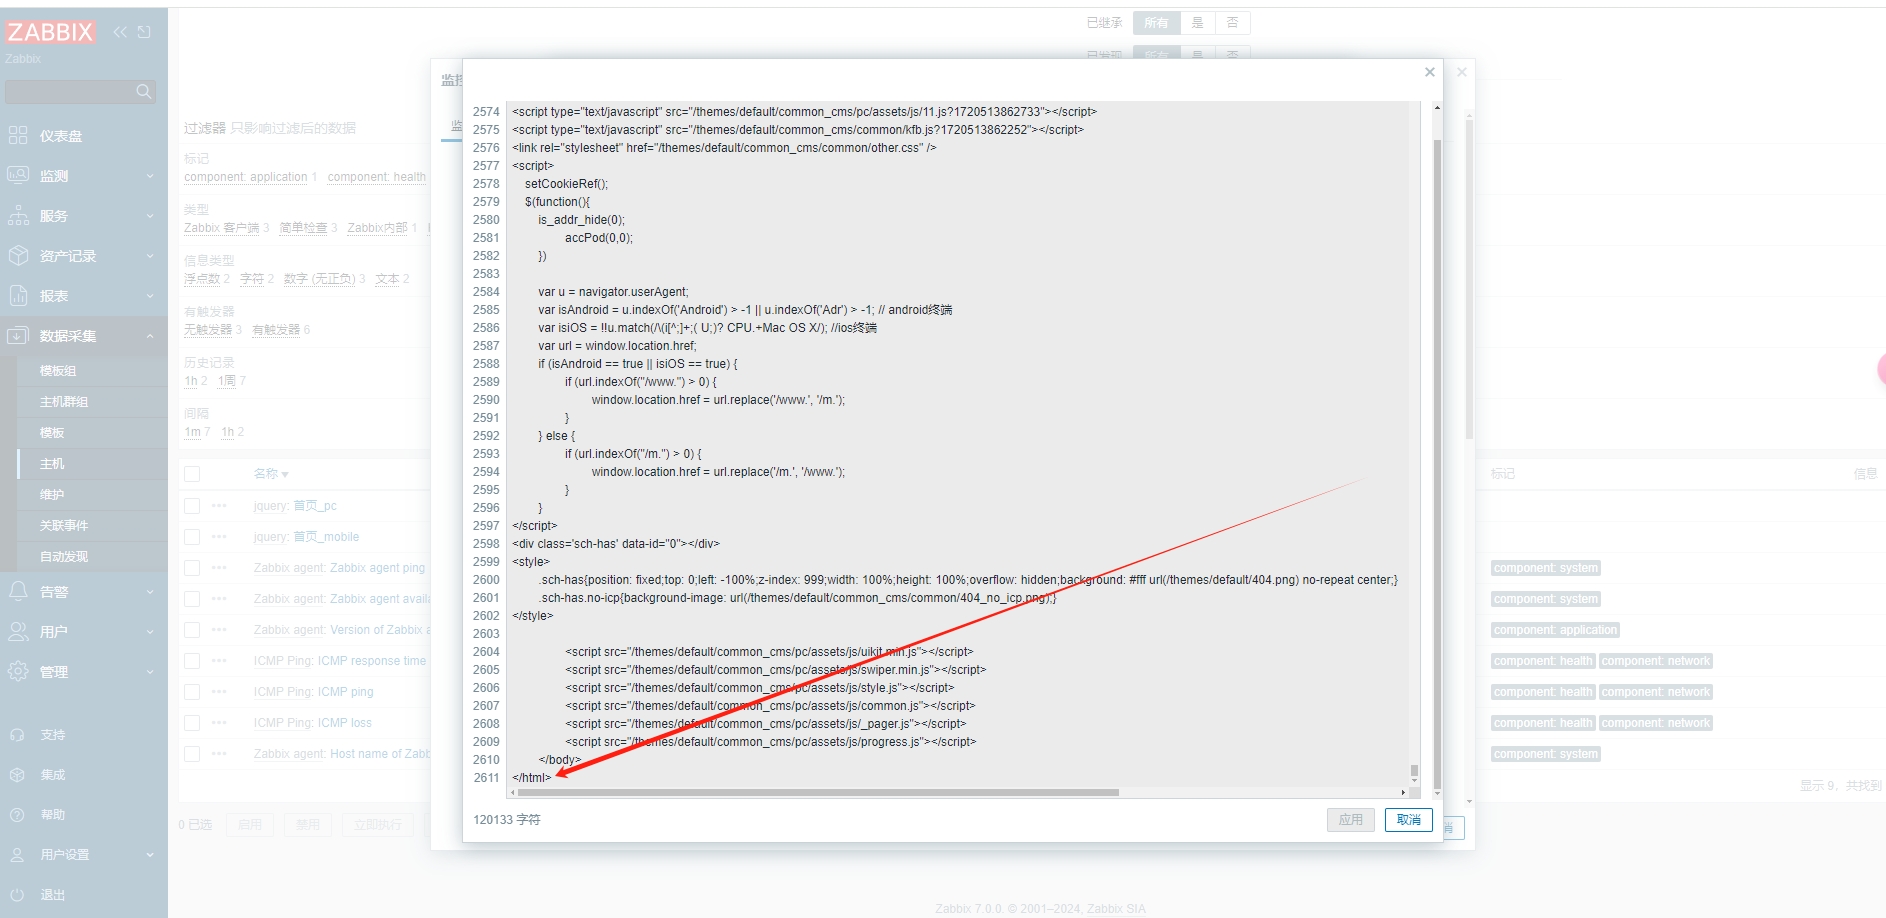
zabbix_get -s 8.8.8.8 -p 10050 -k web.page.get[https://www.58408.com ]
zabbix_agentd -t web.page.get[https://www.58408.com ]
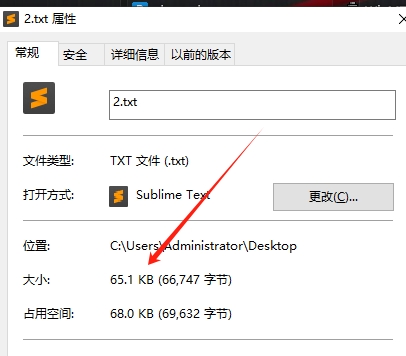
Both of these testing methods returned complete content exceeding 64K in length, but it was truncated to 64K before being stored in the database
I have reviewed the following documents and have not found a solution
https://support.zabbix.com/browse/ZBX-16558
https://support.zabbix.com/browse/ZBX-11117
https://support.zabbix.com/browse/ZBX-6590
https://support.zabbix.com/browse/ZBXNEXT-6109
https://www.zabbix.com/documentation/current/en/manual/config/items/item#text_data_limits
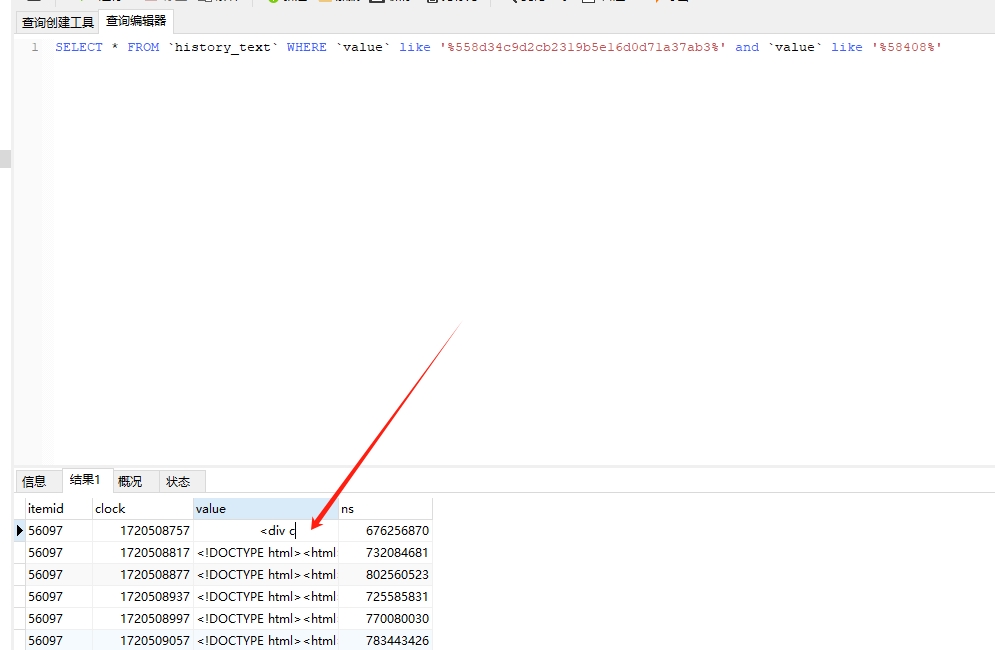
The value type of the field in table history_text has been set to longtext
CREATE TABLE `history_text` (
  `itemid` bigint unsigned NOT NULL,
  `clock` int NOT NULL DEFAULT '0',
  `value` longtext CHARACTER SET utf8mb4 COLLATE utf8mb4_bin NOT NULL,
  `ns` int NOT NULL DEFAULT '0',
  PRIMARY KEY (`itemid`,`clock`,`ns`)
) ENGINE=InnoDB DEFAULT CHARSET=utf8mb4 COLLATE=utf8mb4_bin;
However, when checking the data stored in the latest monitoring items, it has still been truncated to 64K. Please help me, I need to solve this problem