-
Type:
Problem report
-
Resolution: Unresolved
-
Priority:
Trivial
-
None
-
Affects Version/s: 7.0.4
-
Component/s: Server (S)
-
None
Hi
I have a serious issue with our monitoring system.
The issue, is with SNMP interface (perhaps zabbix agent interface also affected, not sure, we are not using it, but I know that zabbix agent active checks are not affected).
So, whenever the host is unavailable litte bit longer (amount of time that will make an item unavailable), then the item will never ** be polled again. The host is 100% up, I can do snmpwalk from zabbix server host for all items, everything is working, I can also test the item from zabbix GUI, I will get correct data, I can also execute the check manually from zabbix GUI, it says that the "Request sent successfully", however the "Last check" column will not change and graphs still show like item data missing.
I even have waited like a day - nothing changes, it will never get available again.
Only thing that helps, I need to restart zabbix-server service, and then it will immediately be working again.
The issue happens mainly during the maintenance, when I do some patching etc, or when we have like a network outage etc..
Zabbix server conf file. I have tried changing UnreachablePeriod to maximum "UnreachablePeriod=3600", hoping the item/host will never go to unavaialble state, but not helping as well.
[root@ee02-zabbix ~]# cat /etc/zabbix/zabbix_server.conf | grep -v "^#" | sort
CacheSize=128M
DBHost=ee02-zabbix.domain.com
DBName=zabbix
DBPassword=XXXXXXXXXXXXXX
DBUser=zabbix
EnableGlobalScripts=0
HANodeName=ee02-zabbix.domain.com
LogFileSize=0
LogFile=/var/log/zabbix/zabbix_server.log
LogSlowQueries=3000
NodeAddress=X.Y.Z.V:10051
PidFile=/run/zabbix/zabbix_server.pid
SNMPTrapperFile=/tmp/zabbix_traps.tmp
SocketDir=/run/zabbix
StartPingers=30
StartPollers=50
StartPollersUnreachable=50
StartSNMPTrapper=1
StartVMwareCollectors=1
StatsAllowedIP=127.0.0.1
Timeout=4
ValueCacheSize=128M
VMwarePerfFrequency=120
Here I will bring an example, from yesterdays patching results with one host.
[root@ee02-zabbix ~]# tail -100000f /var/log/zabbix/zabbix_server.log | grep "ee02-os-ceph07-ilo"
2067297:20241016:222211.773 SNMP agent item "system.net.uptime[sysUpTime.0]" on host "ee02-os-ceph07-ilo.domain.com" failed: first network error, wait for 15 seconds
2067324:20241016:222230.020 SNMP agent item "system.net.uptime[sysUpTime.0]" on host "ee02-os-ceph07-ilo.domain.com" failed: another network error, wait for 15 seconds
2067354:20241016:222234.031 SNMP agent item "system.hw.uptime[hrSystemUptime.0]" on host "ee02-os-ceph07-ilo.domain.com" failed: another network error, wait for 15 seconds
2067313:20241016:222253.022 SNMP agent item "system.hw.uptime[hrSystemUptime.0]" on host "ee02-os-ceph07-ilo.domain.com" failed: another network error, wait for 15 seconds
2067313:20241016:222312.063 temporarily disabling SNMP agent checks on host "ee02-os-ceph07-ilo.domain.com": interface unavailable
2067316:20241016:222524.236 enabling SNMP agent checks on host "ee02-os-ceph07-ilo.domain.com": interface became available
2067302:20241016:230545.749 SNMP agent item "system.bmc.major.version" on host "ee02-os-ceph07-ilo.domain.com" failed: first network error, wait for 15 seconds
2067322:20241016:230600.628 resuming SNMP agent checks on host "ee02-os-ceph07-ilo.domain.com": connection restored
Notice this, it says it was restored, however it wasn't working still.
2067322:20241016:230600.628 resuming SNMP agent checks on host "ee02-os-ceph07-ilo.domain.com": connection restored
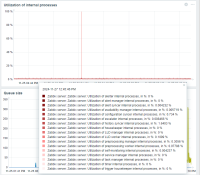
I have provided the screenshot as well.
Now, I know, when the host becomes available again, it will not start polling all the items immediately, because it will overload the server, but I am telling you, I have like waited a day in the past - nothing changes.
For that particular host I am using template "Supermicro Aten by SNMP", this item was polled 30s interval. I recently changed it to 1m interval, hoping it will change something, but not helping.
So for monitoring system to behave like that - so that we can't trust its results - it is unheard of. So basically we can't say with 100% certainity that we don't have an issue, when we have no alerts present on our dashboards !
Also, how can I make sure, that this feature be disabled altogether - like I do not want the host to never go to unavailable state ? Is it perhaps possible to change some values to disable this feature at all ?
- related to
-
ZBXNEXT-9950 Disable SNMPBulk (walk[] item) UnavailableDelay retries
-
- Open
-
-
ZBX-25177 Unavailability mechanism very sensitive for instant network issues
-
- Confirmed
-


