-
Type:
Documentation task
-
Resolution: Fixed
-
Priority:
 Trivial
-
Affects Version/s: 7.0.7, 7.2.1
-
Component/s: Documentation (D)
-
S25-W4/5
-
0.5
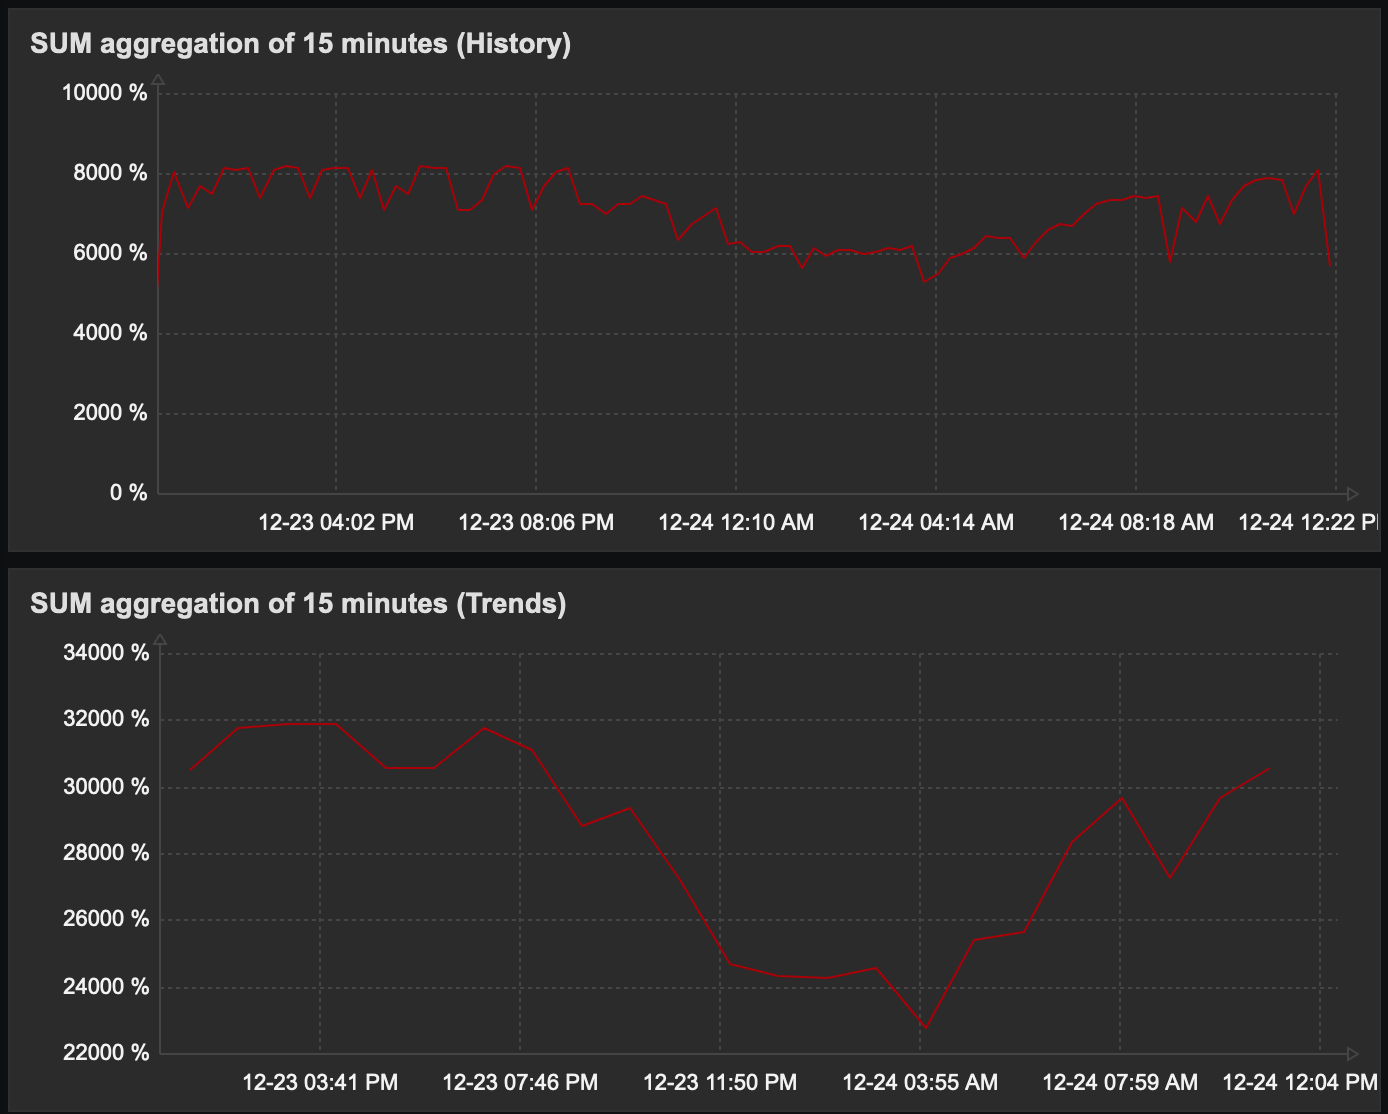
Steps to reproduce:
- Create a dashboard with two graph widgets with a SUM aggregation of 5 minutes each.
- One widget pulls data from history, while the other pulls data from trends.
- Select a display period of one day.
Result:
In the graph based on trends, the values are approximately four times higher than those based on historical data.

- related to
-
ZBX-22350 Vector Graph Aggregations Broken For Datasets
-
- Closed
-
