-
Type:
Problem report
-
Resolution: Fixed
-
Priority:
Trivial
-
Affects Version/s: 6.2.7
-
Component/s: Frontend (F)
-
Environment:Rocky 8.7, Zabbix 6.2.7
-
S24-W38/39, S24-W40/41, S24-W42/43, S24-W46/47, S24-W48/49
-
2
Zabbix Team -
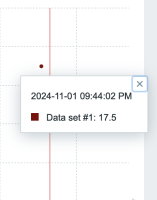
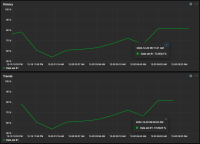
The vector graph widget aggregations are broken in 6.2 and probably 6.4 (6.0 is fine). For example, plot 2 metrics in the graph widget. Let's just say the values for both items are always "50". Then change the aggregation from 'none' to 'sum'. If you aggregate by each item it's fine and both items will still show "50" no matter what the aggregation interval. If you stack them, you get "100". However, if you change it to aggregate the dataset instead of each item you lose the second item and any others you add to the dataset and the value will always be "50".
I was able to track this down in CSvgGraphHelper.php. In version 6.0 there was a switch statement to handle the proper aggregation, but it looks like that code was ripped out and wasn't migrated anywhere else starting in version 6.2. I'm guessing this was missed while adding the new graph widget features in version 6.2.
I was able to patch this on my system by adding the switch statements back. For example:
                               $new_metric_points = [];
                                switch ($metric['options']['aggregate_function']) {
                                        case AGGREGATE_MIN:
                                                foreach ($metric_points as $tick => $point)

{                                                         $new_metric_points[$tick]['value'][] = min($point['value']);                                                 }

                                                break;
                                        case AGGREGATE_MAX:
                                                foreach ($metric_points as $tick => $point)

{                                                         $new_metric_points[$tick]['value'][] = max($point['value']);                                                 }

                                                break;
                                        case AGGREGATE_AVG:
                                                foreach ($metric_points as $tick => $point)

{                                                         $new_metric_points[$tick]['value'][] = CMathHelper::safeAvg($point['value']);                                                 }

                                                break;
                                        case AGGREGATE_COUNT:
                                                foreach ($metric_points as $tick => $point)

{                                                         $new_metric_points[$tick]['value'][] = array_sum($point['value']);                                                 }

                                                break;
                                       case AGGREGATE_SUM:
                                               foreach ($metric_points as $tick => $point)

{                                                        $new_metric_points[$tick]['value'][] = array_sum($point['value']);                                                 }

                                               break;
And then just set $metric_points = $new_metric_points before looping through to build the $metric['points'] array with the approximations for avg, min and max.
Also, I don't really understand the use of 'first' and 'last', so I did not include those case statements above. 'first' and 'last' don't really seem well-defined. Perhaps that is a topic for a different ticket though.
- caused by
-
ZBXNEXT-6940 Vector graph widget improvements
-
- Closed
-
- is duplicated by
-
ZBX-24768 Dashboard Graph: Summation of data set based on host and image pattern not working
-
- Closed
-
- related to
-
ZBX-25791 SUM aggregation on trends works incorrectly if the aggregation interval is not a multiple of one hour.
-
- Closed
-


