-
Type:
Problem report
-
Resolution: Unresolved
-
Priority:
 Trivial
-
None
-
Affects Version/s: 6.0.40
-
Component/s: Frontend (F)
-
None
Steps to reproduce:
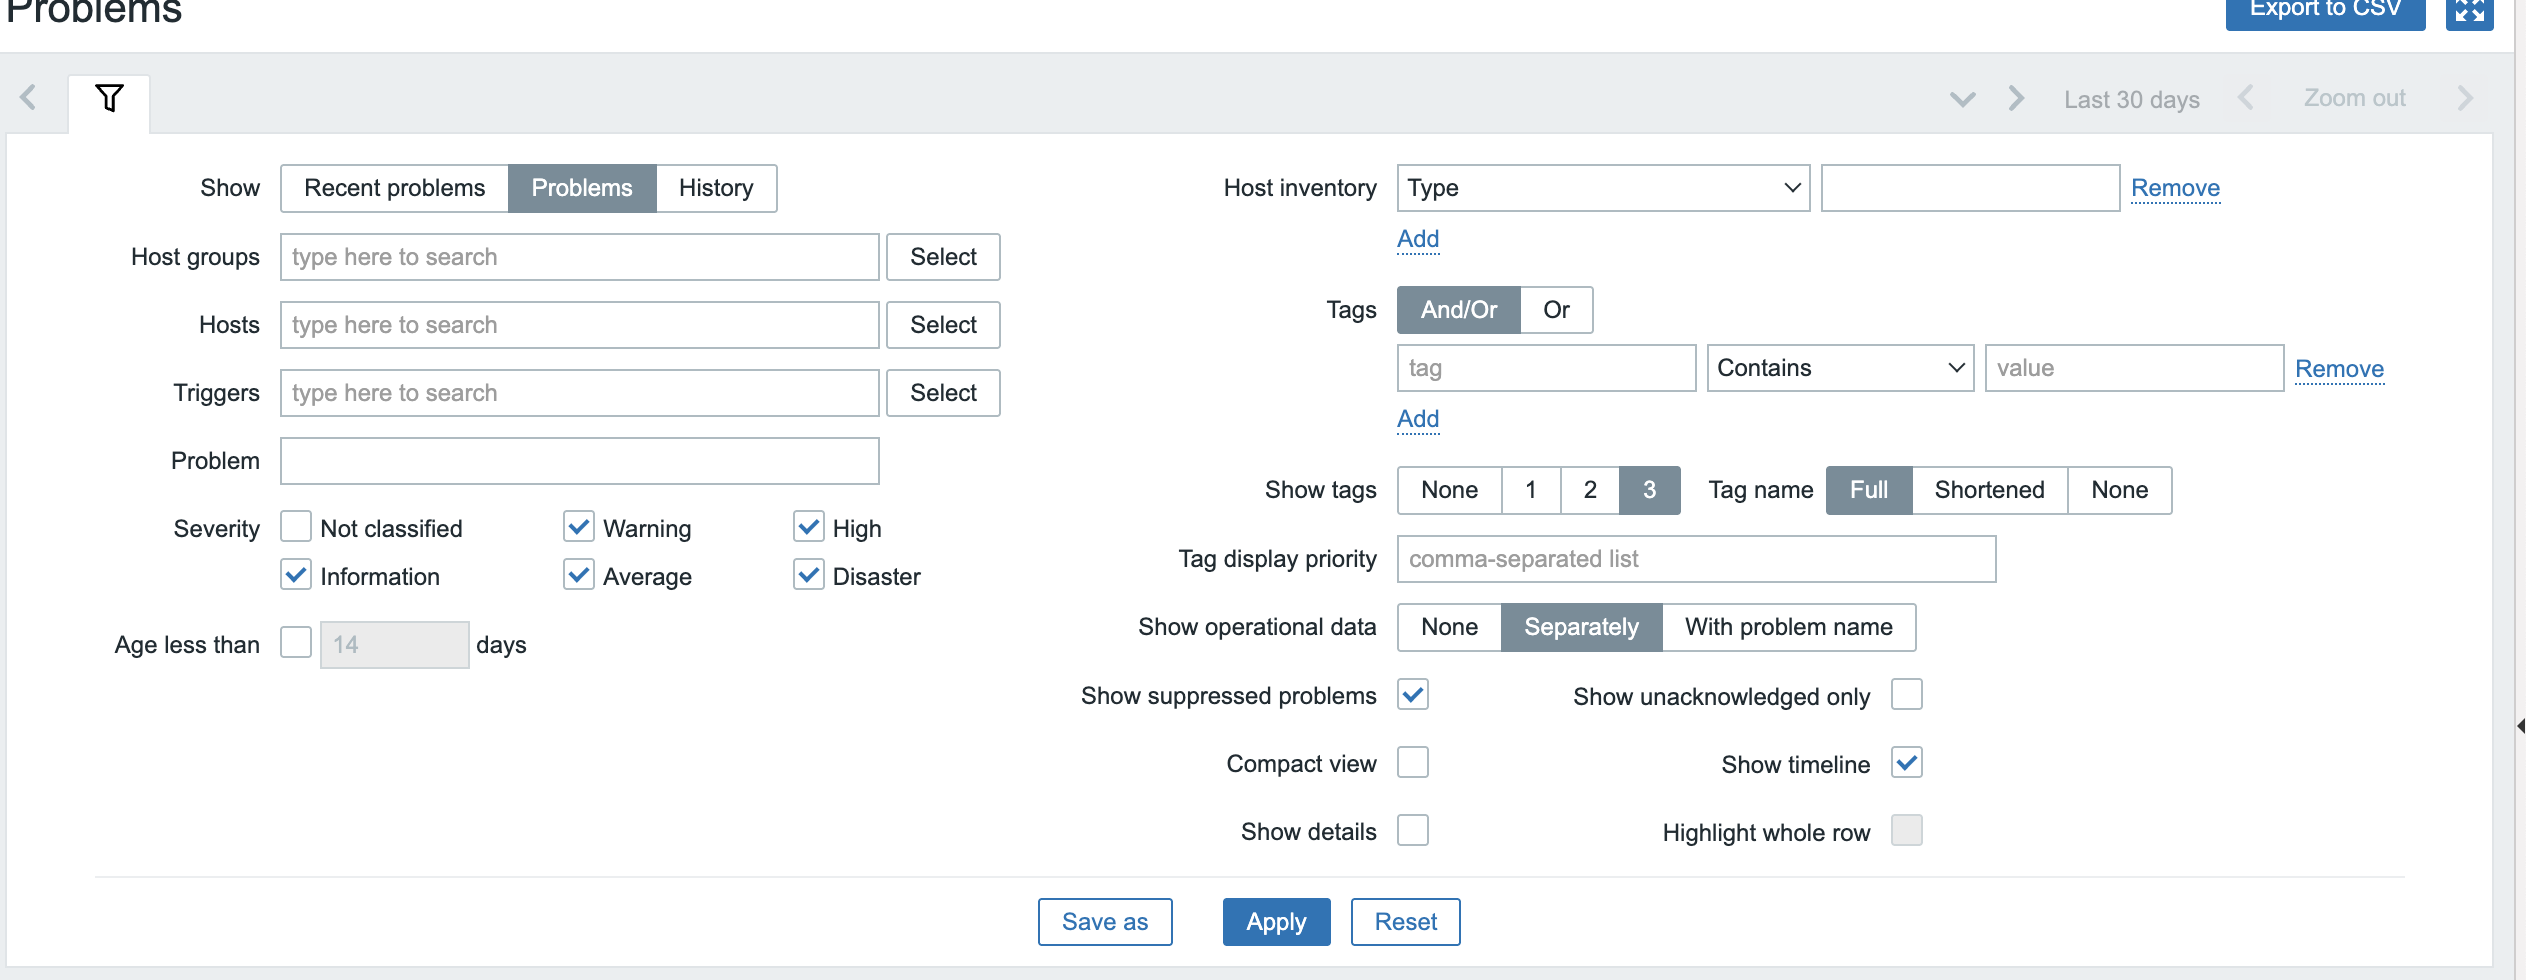
After upgrade from 6.0.37 -> 6.0.40 we see very slow loading of Problems page if filter by several severities.
- If no filter or only one severity selected - page works fast.
- If 2 or more severities - query to DB can take 30–70 sec.
Usually this happen for regular users with big permission sets. But now same problem also for superadmin, first time I see this behavior.
For examle in mysql_slow.log
Result:
# Query_time: 49.048568  Lock_time: 0.000002  Rows_sent: 100  Rows_examined: 13979684  Rows_affected: 0  Bytes_sent: 1973
SET timestamp=1755509396;
SELECT COUNT(*) AS rowscount,a.eventid FROM alerts a WHERE EXISTS (SELECT NULL FROM actions aa WHERE a.actionid=aa.actionid AND aa.eventsource='0') AND a.eventid IN (816157075,816878766,816897200,818982561,821510431,821511008,822452883,822453140,823695312,823791562,823910460,831214976,831215083,831215386,832494121,832494756,832918602,833156936,833156939,833291474,833296305,834664261,836248526,839594245,840028183,840201570,840214074,840218783,840218786,840277589,840435136,840489623,841071662,841111704,841329026,841330738,841331034,841331455,841331461,841331583,841331697,841331847,841332355,841332983,841333134,841333256,841333547,841333877,841333949,841334239,841334346,841334656,841386072,841467171,841472083,841474159,841474167,841474170,841474175,841474250,841576556,841578869,841579195,841580162,841580316,841652367,841684736,841684955,841685333,841685678,841686200,841694601,841697275,841698296,841700379,841702281,841724463,841733067,841802147,841892123,841898561,841929824,841932690,841932991,841933500,841933642,841934551,841935403,841935408,841935409,841935901,841948774,841948775,841948777,841948779,841948780,842057823,842057824,842057826,842059489) GROUP BY a.eventid;
equivalent as
SELECT COUNT(*) AS rowscount,a.eventid
FROM alerts a
WHERE EXISTS (SELECT NULL FROM actions aa
              WHERE a.actionid=aa.actionid AND aa.eventsource='0')
  AND a.eventid IN (.... long list of ids ....)
GROUP BY a.eventid;
This query scan ~14M rows in alerts.
Even with filter “Age less than 14 days” -< still slow, because optimizer scan all alerts by actionid first and only then apply eventid filter.
-> Table scan on <temporary>  (actual time=73594..73594 rows=100 loops=1)
    -> Aggregate using temporary table  (actual time=73594..73594 rows=100 loops=1)
        -> Nested loop inner join  (cost=40770 rows=1560) (actual time=8.85..73551 rows=139149 loops=1)
            -> Covering index lookup on aa using actions_1 (eventsource=0)  (cost=1.56 rows=13) (actual time=0.0219..0.0323 rows=13 loops=1)
            -> Filter: (a.eventid in (...long list...))
               (cost=2241 rows=120) (actual time=41.7..5657 rows=10704 loops=13)
                -> Index lookup on a using alerts_1 (actionid=aa.actionid)
                   (cost=2241 rows=8960) (actual time=0.265..5597 rows=1.07e+6 loops=13)
Optimizer starts from actions table, then scan ~1.07M rows per actionid (13 actionids * 1.07M = ~14M rows). Very slow.
workaround on our side:
We created composite index and used ProxySQL to rewrite query with index hint.
CREATE INDEX alerts_eventid_actionid_idx ON alerts (eventid, actionid);
If we force to use this index - it works really fast.
old:
mysql> SELECT COUNT(*) AS rowscount,a.eventid FROM alerts a WHERE EXISTS (SELECT NULL FROM actions aa WHERE a.actionid=aa.actionid AND aa.eventsource='0') AND a.eventid IN (a lot of ids) GROUP BY a.eventid;
...
100 rows in set (36.64 sec)

| -> Table scan on <temporary>  (actual time=38547..38547 rows=100 loops=1)
    -> Aggregate using temporary table  (actual time=38547..38547 rows=100 loops=1)
        -> Nested loop inner join  (cost=29240 rows=957) (actual time=8.92..38513 rows=128321 loops=1)
            -> Covering index lookup on aa using actions_1 (eventsource=0)  (cost=1.56 rows=13) (actual time=0.032..0.046 rows=13 loops=1)
            -> Filter: (a.eventid in (a lot of IDs))  (cost=1607 rows=73.6) (actual time=56.1..2962 rows=9871 loops=13)
                -> Index lookup on a using alerts_1 (actionid=aa.actionid)  (cost=1607 rows=6426) (actual time=0.292..2904 rows=1.08e+6 loops=13)
 1 row in set, 1 warning (38.55 sec)
new:
mysql> SELECT COUNT(*) AS rowscount,a.eventid FROM alerts a USE INDEX(alerts_eventid_actionid_idx) WHERE EXISTS (SELECT NULL FROM actions aa WHERE a.actionid=aa.actionid AND aa.eventsource='0') AND a.eventid IN (a lot of IDs) GROUP BY a.eventid;
100 rows in set (0.06 sec)


mysql> EXPLAIN ANALYZE SELECT COUNT(*) AS rowscount,a.eventid FROM alerts a USE INDEX(alerts_eventid_actionid_idx) WHERE EXISTS (SELECT NULL FROM actions aa WHERE a.actionid=aa.actionid AND aa.eventsource='0') AND a.eventid IN ( a lot of IDs) GROUP BY a.eventid;

| -> Group aggregate: count(0)  (cost=81379 rows=104261) (actual time=0.356..102 rows=100 loops=1)
    -> Nested loop inner join  (cost=70953 rows=104261) (actual time=0.0452..96.6 rows=128321 loops=1)
        -> Filter: (a.eventid in (a lot of IDs))  (cost=26040 rows=128321) (actual time=0.0337..51.8 rows=128321 loops=1)
            -> Covering index range scan on a using alerts_eventid_actionid_idx over (eventid = 676209621) OR (eventid = 692834226) OR (98 more)  (cost=26040 rows=128321) (actual time=0.0321..42 rows=128321 loops=1)
        -> Filter: (aa.eventsource = 0)  (cost=0.25 rows=0.812) (actual time=176e-6..237e-6 rows=1 loops=128321)
            -> Single-row index lookup on aa using PRIMARY (actionid=a.actionid)  (cost=0.25 rows=1) (actual time=80e-6..99.4e-6 rows=1 loops=128321)

1 row in set, 1 warning (0.11 sec)
SHOW INDEX FROM alerts (after index creation):
+--------+------------+-----------------------------+--------------+---------------+-----------+-------------+
| Table  | Non_unique | Key_name                    | Seq_in_index | Column_name   | Collation | Cardinality |
+--------+------------+-----------------------------+--------------+---------------+-----------+-------------+
| alerts |          0 | PRIMARY                     |            1 | alertid       | A         |    10295047 |
| alerts |          1 | alerts_1                    |            1 | actionid      | A         |        1159 |
| alerts |          1 | alerts_2                    |            1 | clock         | A         |     4412831 |
| alerts |          1 | alerts_3                    |            1 | eventid       | A         |     1151872 |
| alerts |          1 | alerts_5                    |            1 | mediatypeid   | A         |        1106 |
| alerts |          1 | alerts_6                    |            1 | userid        | A         |        1762 |
| alerts |          1 | alerts_7                    |            1 | p_eventid     | A         |      222858 |
| alerts |          1 | alerts_4                    |            1 | status        | A         |         630 |
| alerts |          1 | c_alerts_6                  |            1 | acknowledgeid | A         |       18334 |
| alerts |          1 | alerts_8                    |            1 | acknowledgeid | A         |       20950 |
| alerts |          1 | alerts_eventid_actionid_idx |            1 | eventid       | A         |      654645 |
| alerts |          1 | alerts_eventid_actionid_idx |            2 | actionid      | A         |      358999 |
+--------+------------+-----------------------------+--------------+---------------+-----------+-------------+
Also we have proxysql in front of mysql and we rewrote it for fixing our problem for now:
SELECT COUNT(*) AS rowscount,a.eventid
FROM alerts a USE INDEX(alerts_eventid_actionid_idx)
WHERE EXISTS (SELECT NULL
              FROM events e,functions f,items i,hosts_groups hgg
              JOIN rights r ON r.id=hgg.groupid AND r.groupid IN (?,?,?)
              WHERE a.eventid=e.eventid AND e.objectid=f.triggerid
                AND f.itemid=i.itemid AND i.hostid=hgg.hostid
              GROUP BY f.triggerid
              HAVING MIN(r.permission)>? AND MAX(r.permission)>=?)
  AND EXISTS (SELECT NULL FROM actions aa
              WHERE a.actionid=aa.actionid AND aa.eventsource=?)
  AND (a.userid IS NULL OR EXISTS (
        SELECT NULL FROM users_groups ug
        WHERE ug.userid=a.userid AND ug.usrgrpid IN (?,?,?)))
  AND a.eventid=?
  AND a.status IN (?,?)
GROUP BY a.eventid;
Ideas:
- Change frontend SQL to prefer (eventid, actionid) index, not (actionid) only.
- Or add optimizer hint / force better index usage.
- Or restructure SQL so filtering by eventid happens first, not after full actionid scan.
Environment:
- Zabbix 6.0.40 (was OK on 6.0.37) On Oracle Linux 9.5
- Percona 8 8.0.39-30 with InnoDB, ~13M+ rows in alerts
- ProxySQL in front (used for query rewrite workaround)
- User role: superadmin (issue visible here, not only regular users)
