-
Type:
Incident report
-
Resolution: Won't fix
-
Priority:
 Major
Major
-
None
-
Affects Version/s: 1.8.15
-
Component/s: Server (S)
-
Environment:Virtuozzo's Virtual Private Server with Centos 6.
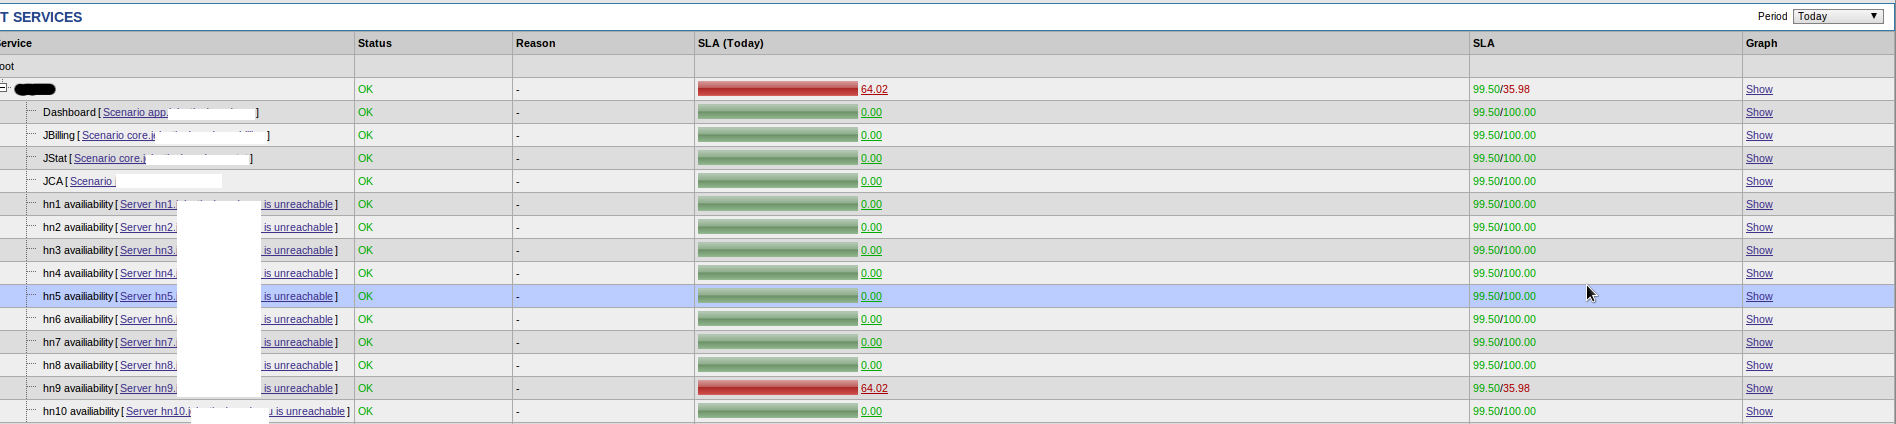
We uses Zabbix 1.8.15. On Monitoring --> IT servises --> SLA found hardnode hn9 with downtime but status is OK and it really works (hn9_sla_today.png).
Also there were no problem triggers on Dashboard (Monitoring).
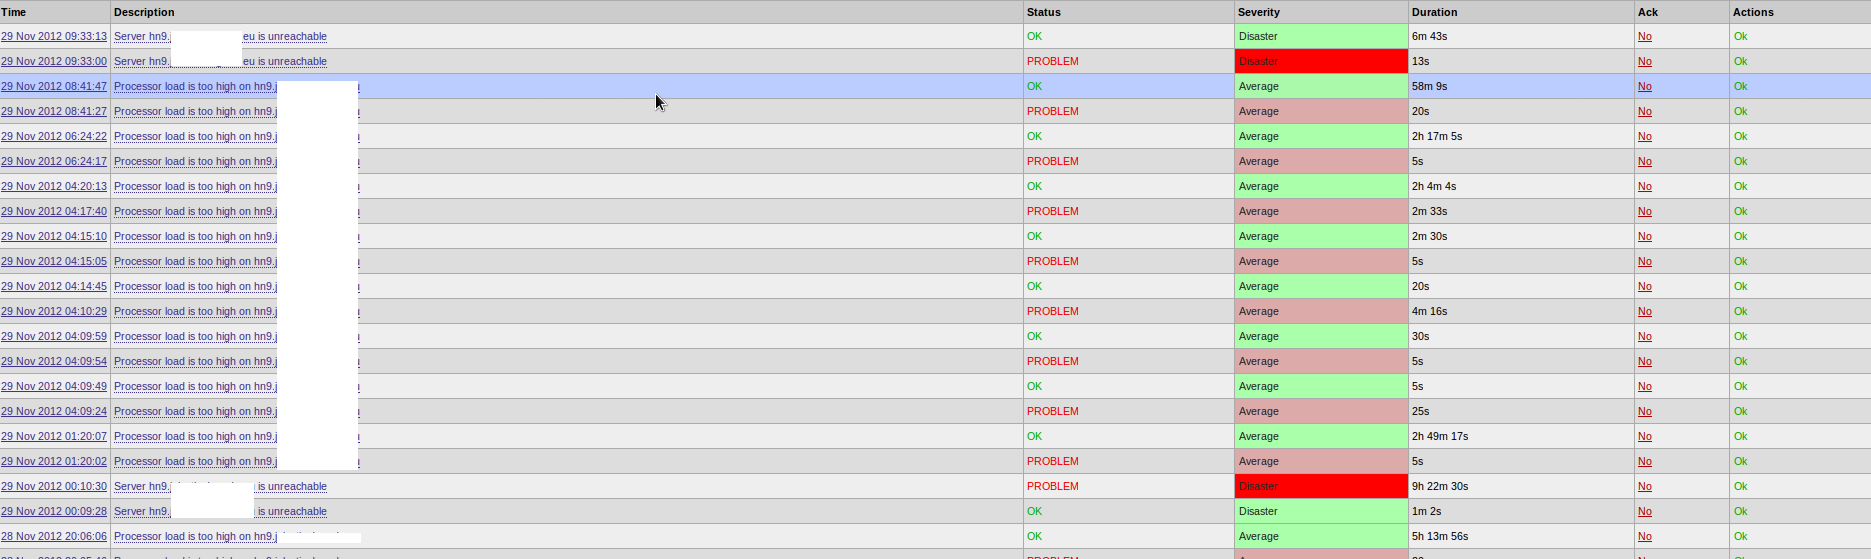
Open Monitoring --> Events -->Host <hn9> and found that according trigger 00:09:28 "Server hn9 is unreachable" has status OK previously than status PROBLEM and its durations are equal 1m 02s (hn9_sla_events.png).
At 09:33 manually executed trigger actuating to PROBLEM and after to OK (hn9_sla_events_restart.png) last trigger status seted to OK.
After that SLA started calculating as hardnode hn9 is up and duration of old trigger PROBLEM at 00:10:30 turned to 9h 22m (period to 09:33:13).
What the reason that Event values are incorrect?
Can it affects SLA?
Such problems found on another Zabbix servers (1.8.15).
How we can fix it?