-
Type:
New Feature Request
-
Resolution: Fixed
-
Priority:
 Major
Major
-
Affects Version/s: None
-
Component/s: None
-
None
-
Sprint 35, Sprint 36, Sprint 37, Sprint 38, Sprint 39, Sprint 40, Sprint 41, Sprint 42, Sprint 43, Sprint 44, Sprint 45, Sprint 46, Nov 2018, Sprint 47, Dec 2018, Sprint 48, Jan 2019
-
14.5
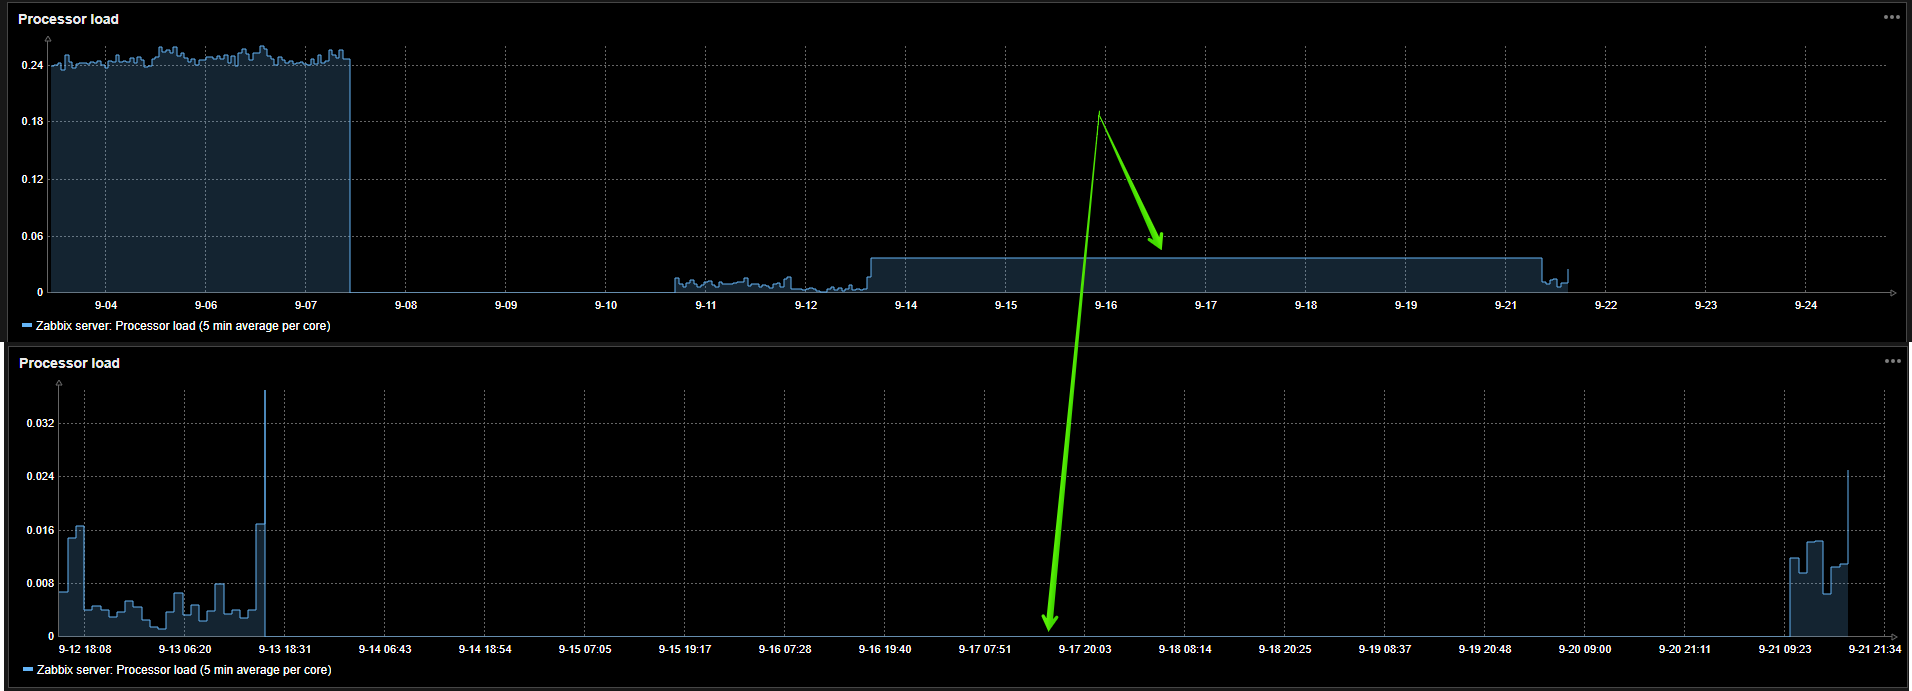
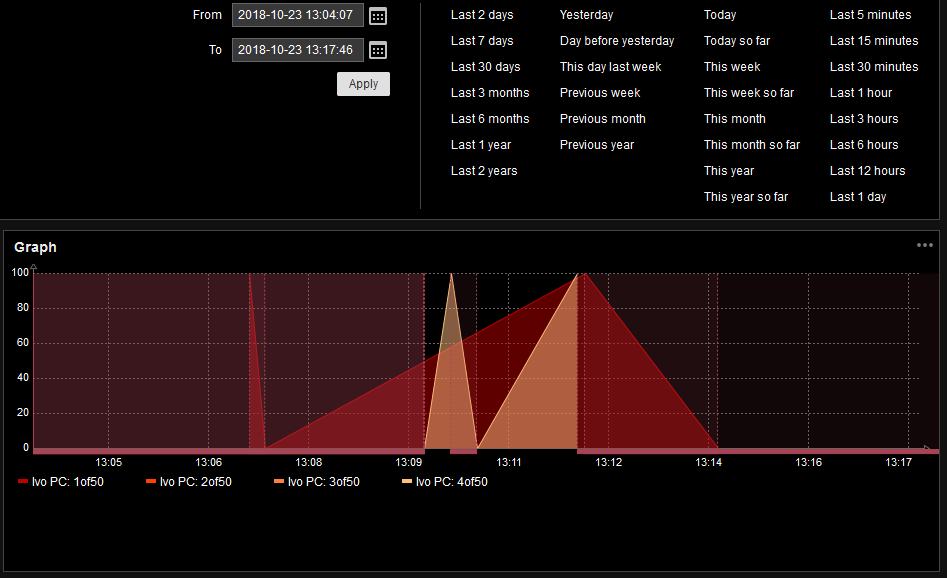
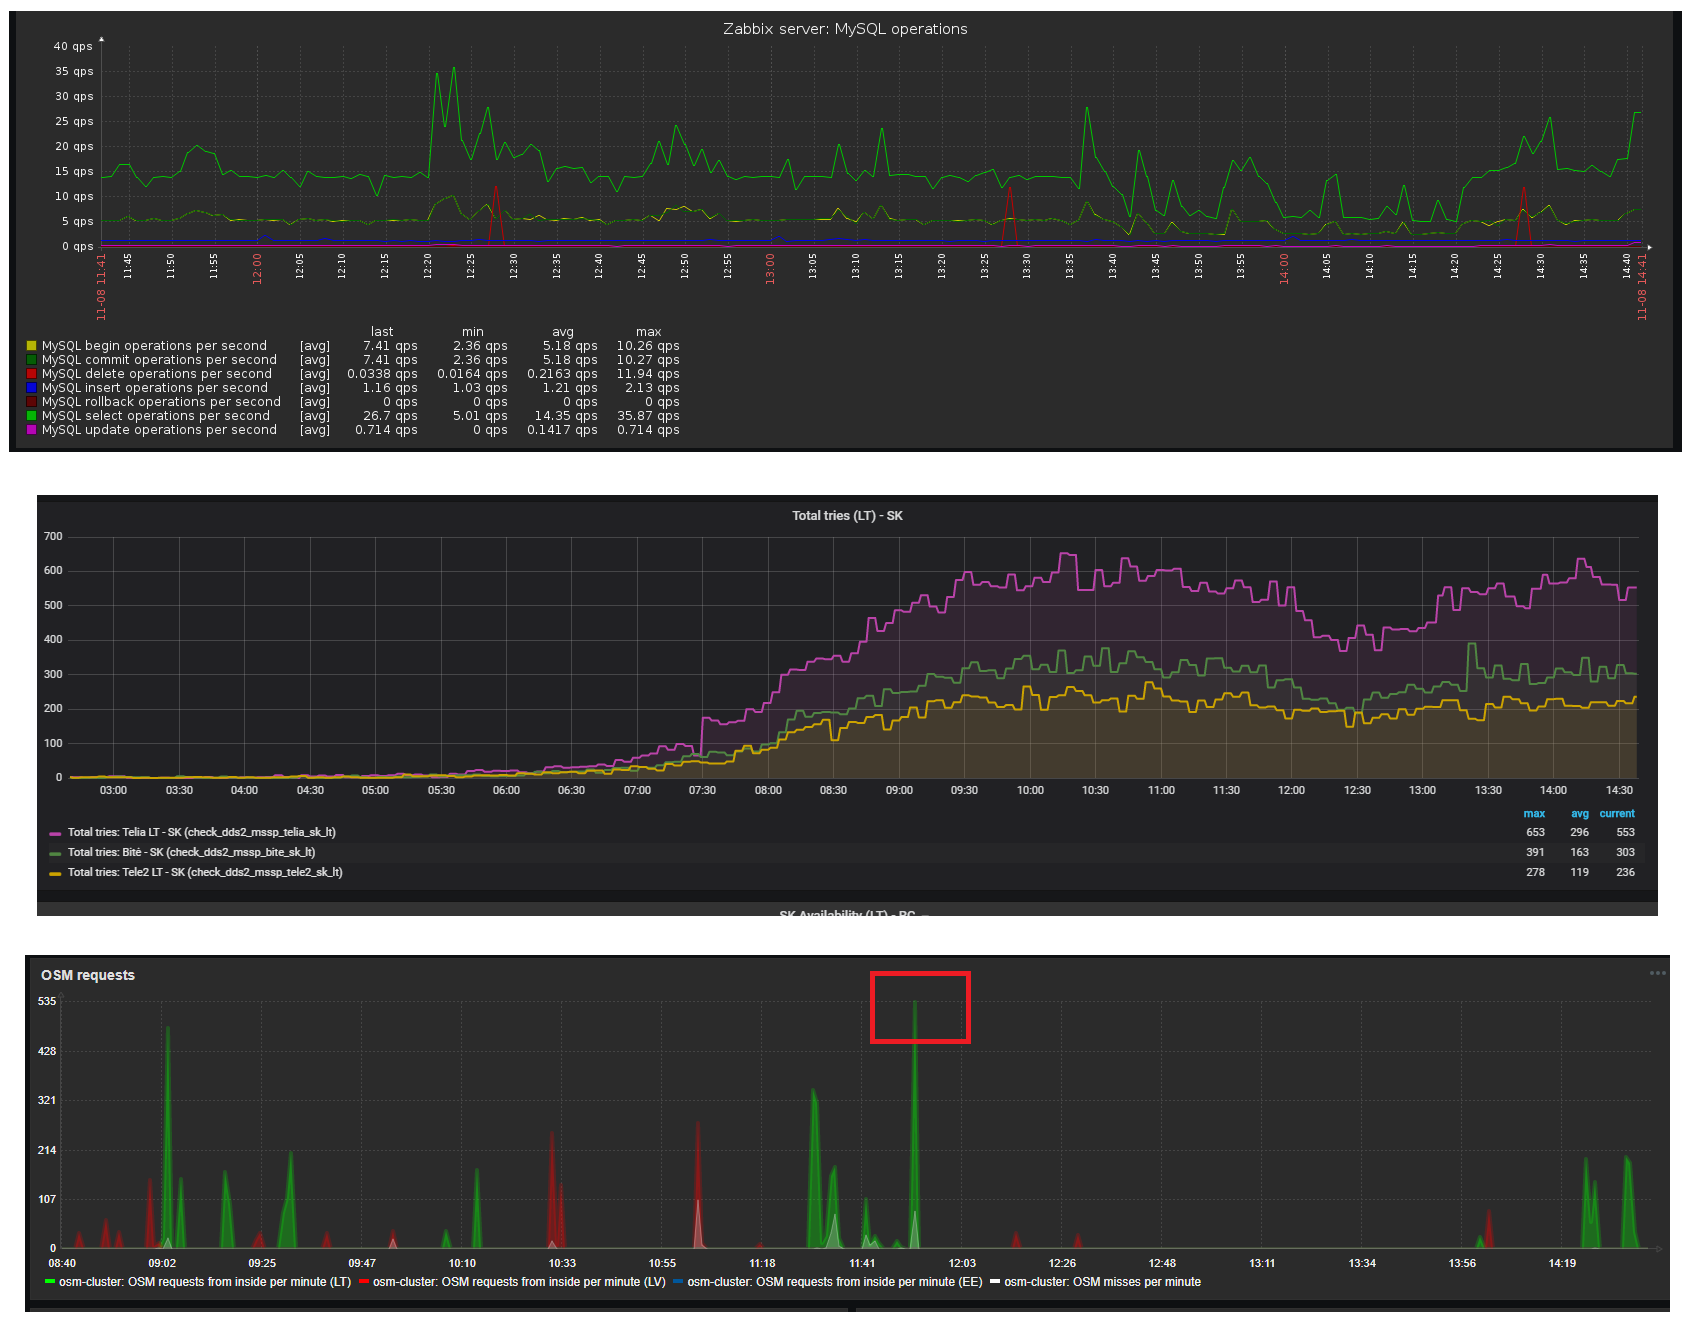
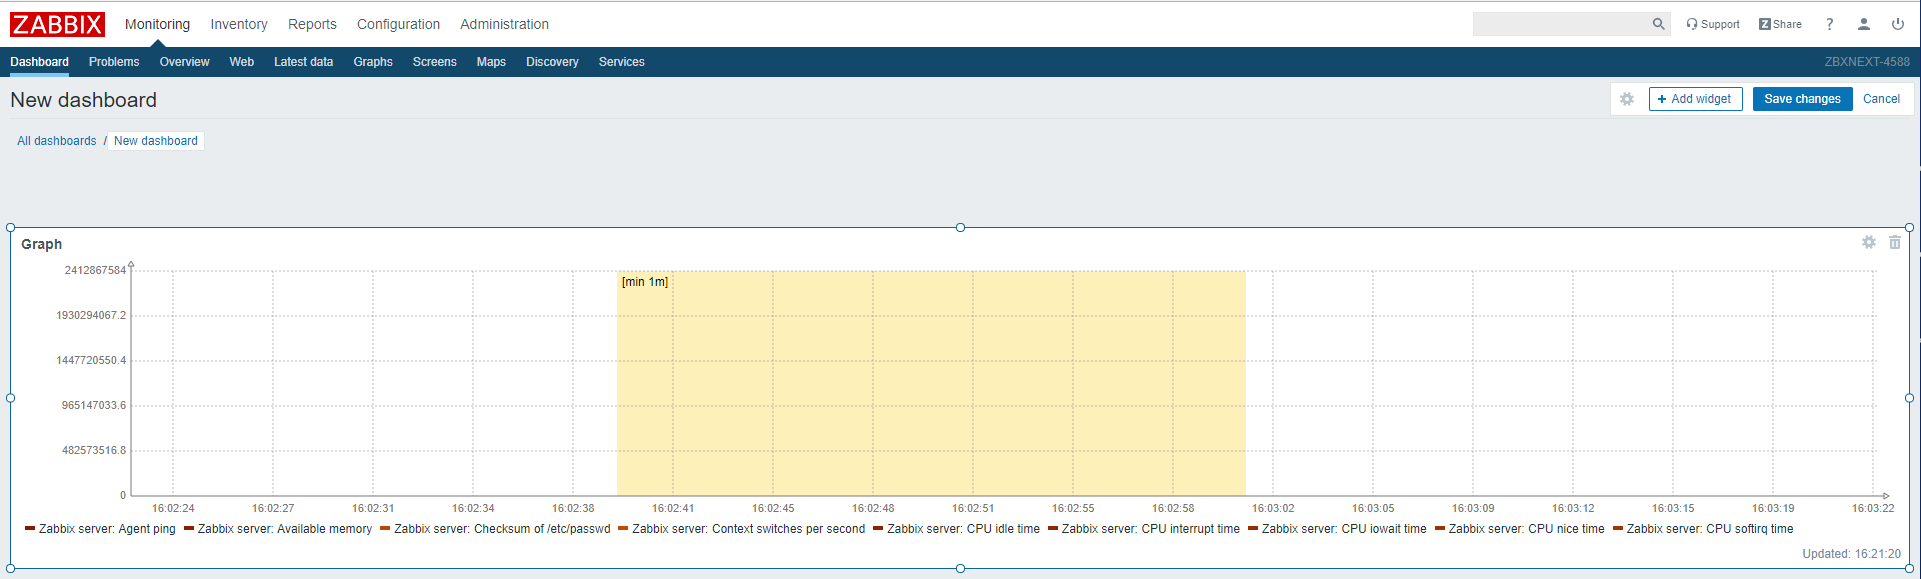
The core functionality is to create a new type of widget that will be flexible enough for the most use cases required for ad-hoc graphing.
The new widget must support:
- Server-side SVG based graph generation
- Ability to select set of items for graphing using one or more conditions:
- Host and item name
- Both host and item name will support character '*' for pattern matching
- Ability to overwrite graphing options for a set of items selected using one or more conditions:
- Host and item name
- Both host and item name will support character '*' for pattern matching
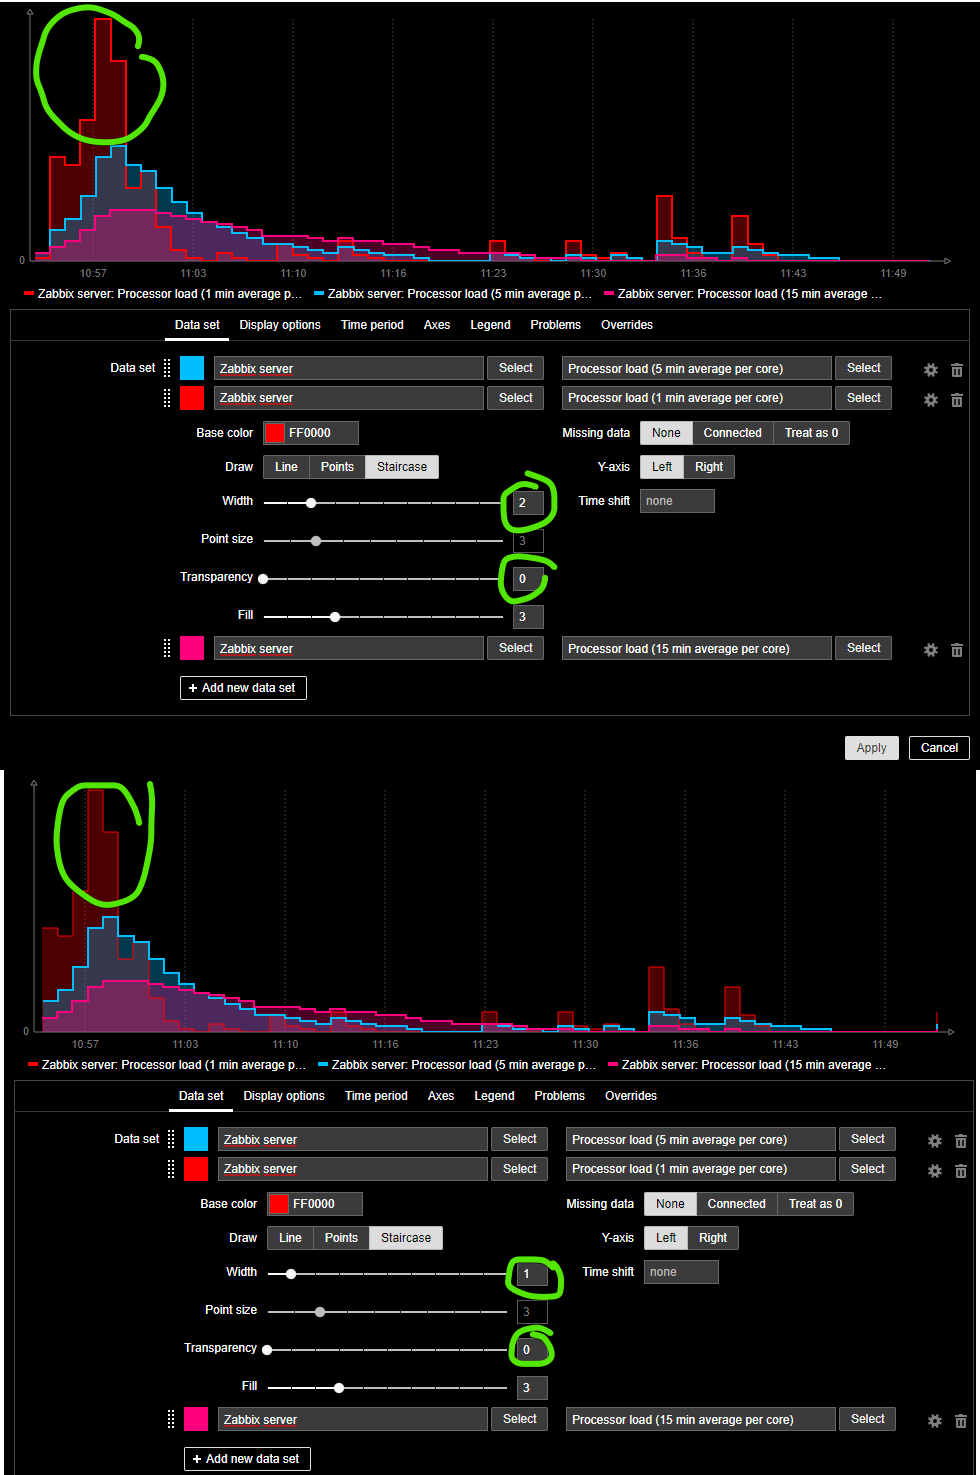
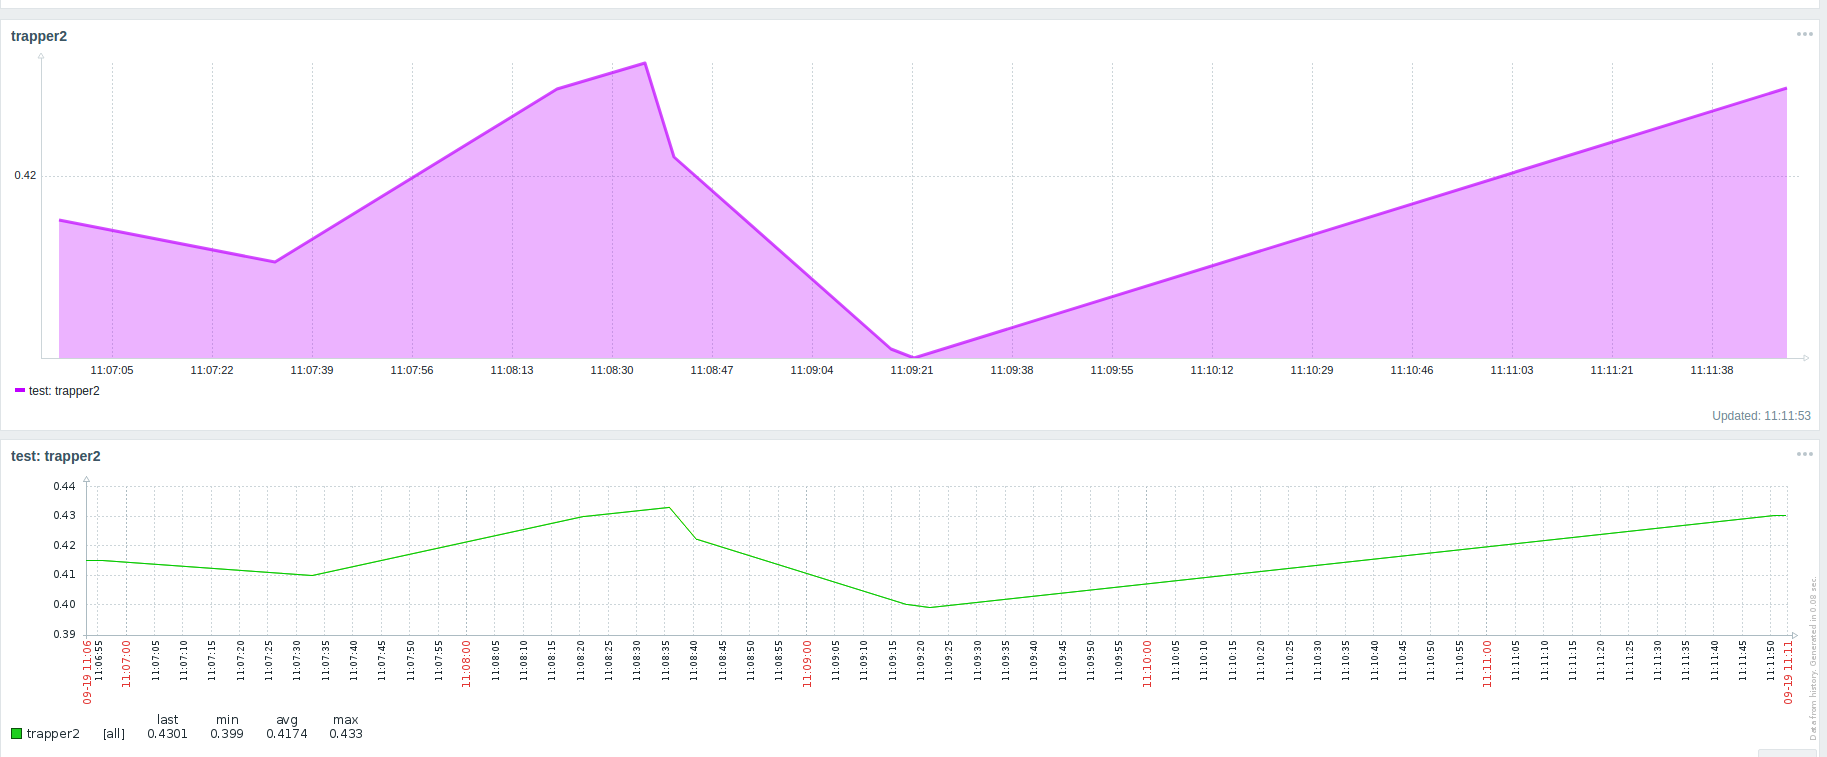
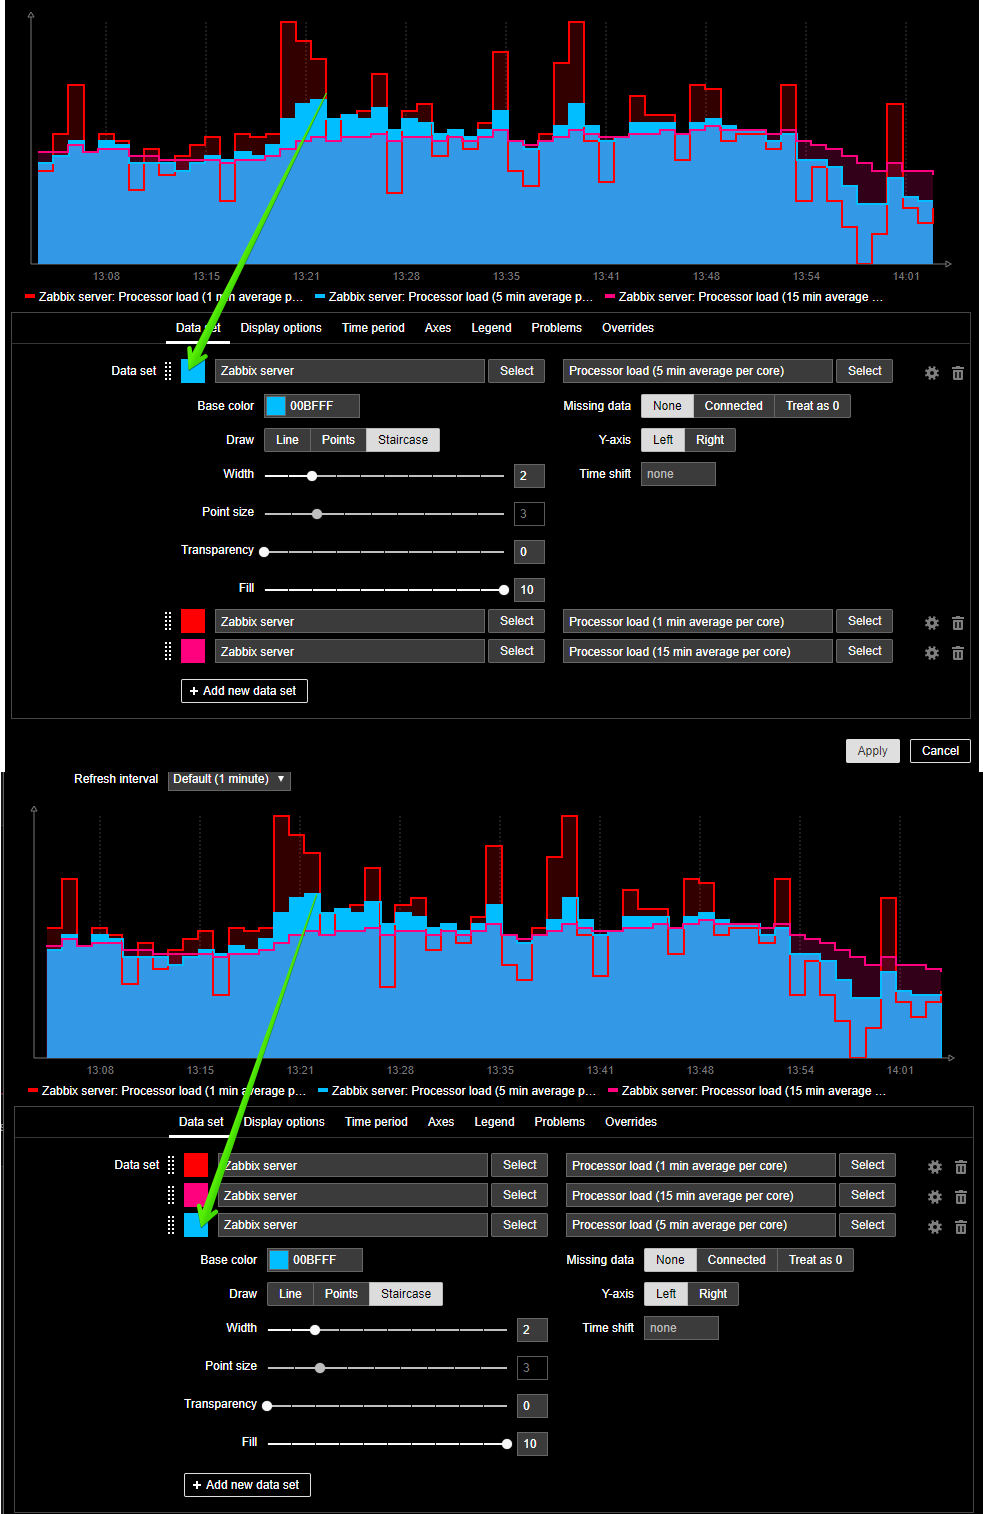
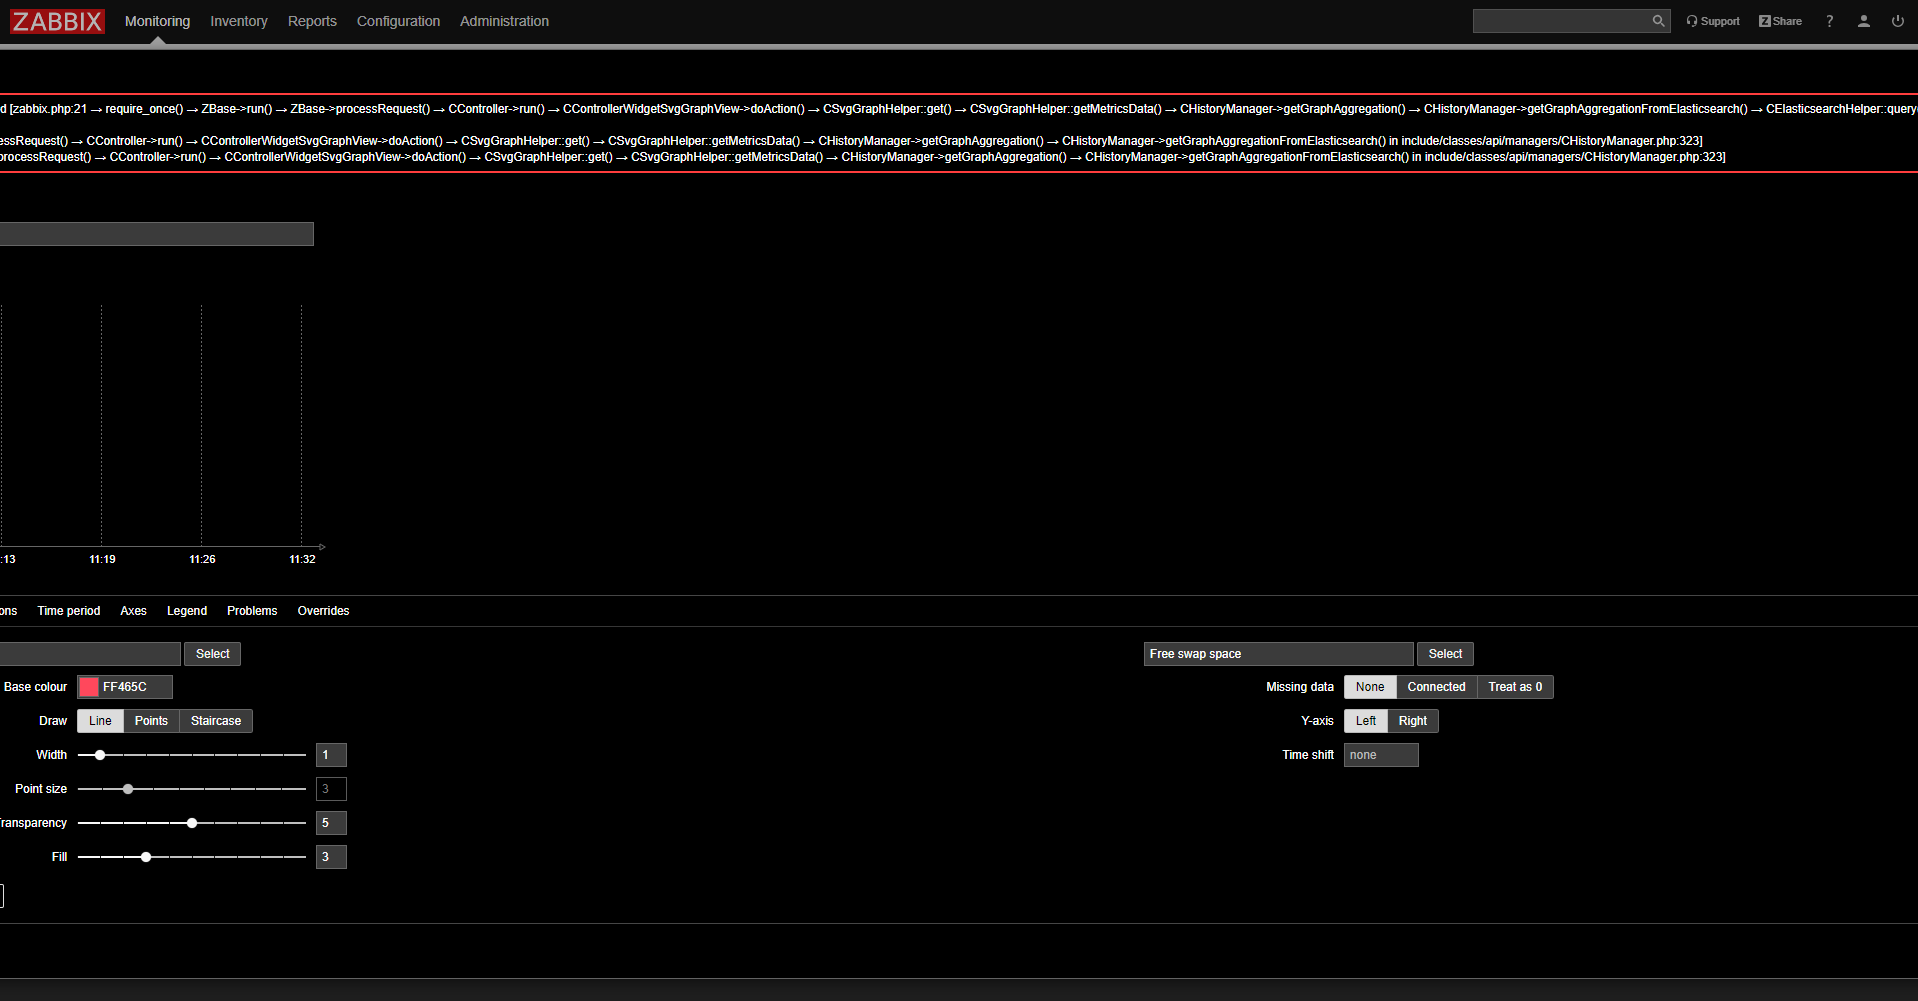
- Each data set will support the following options
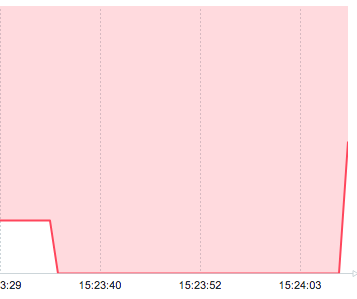
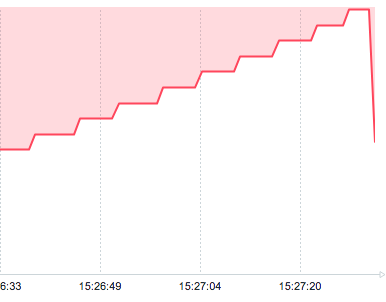
- Draw type: Lines, Points, Staircase
- Additional optional attributes for different draw types:
- Filled (0-10, 5 (30%) is default): fill it, available for Lines
- Radius (3 is default): available for Points.
- Additional optional attributes for different draw types:
- Color: selection of color
- Width (0-10, 1 is default): line width
- Transparency (0-10, 5 (50%) is default): transparency level.
- Y axis: Left (default), Right
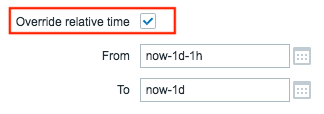
- Time shift: none (default) or using format like -1h, 1h, -1d, -1m, etc.
- Time period: none (default) or override using Time from and Time to.
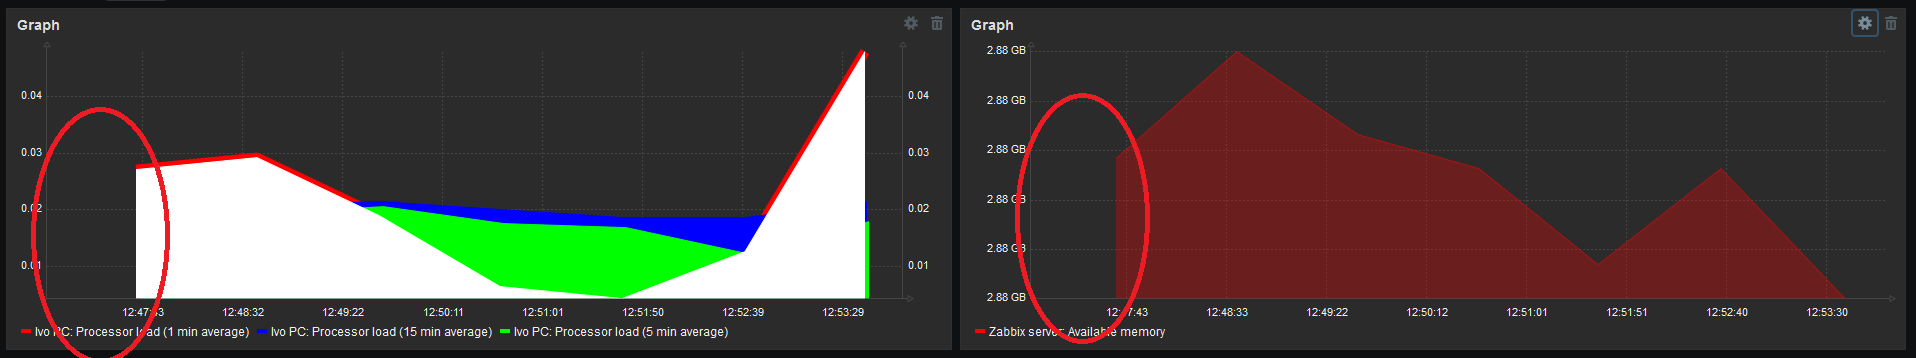
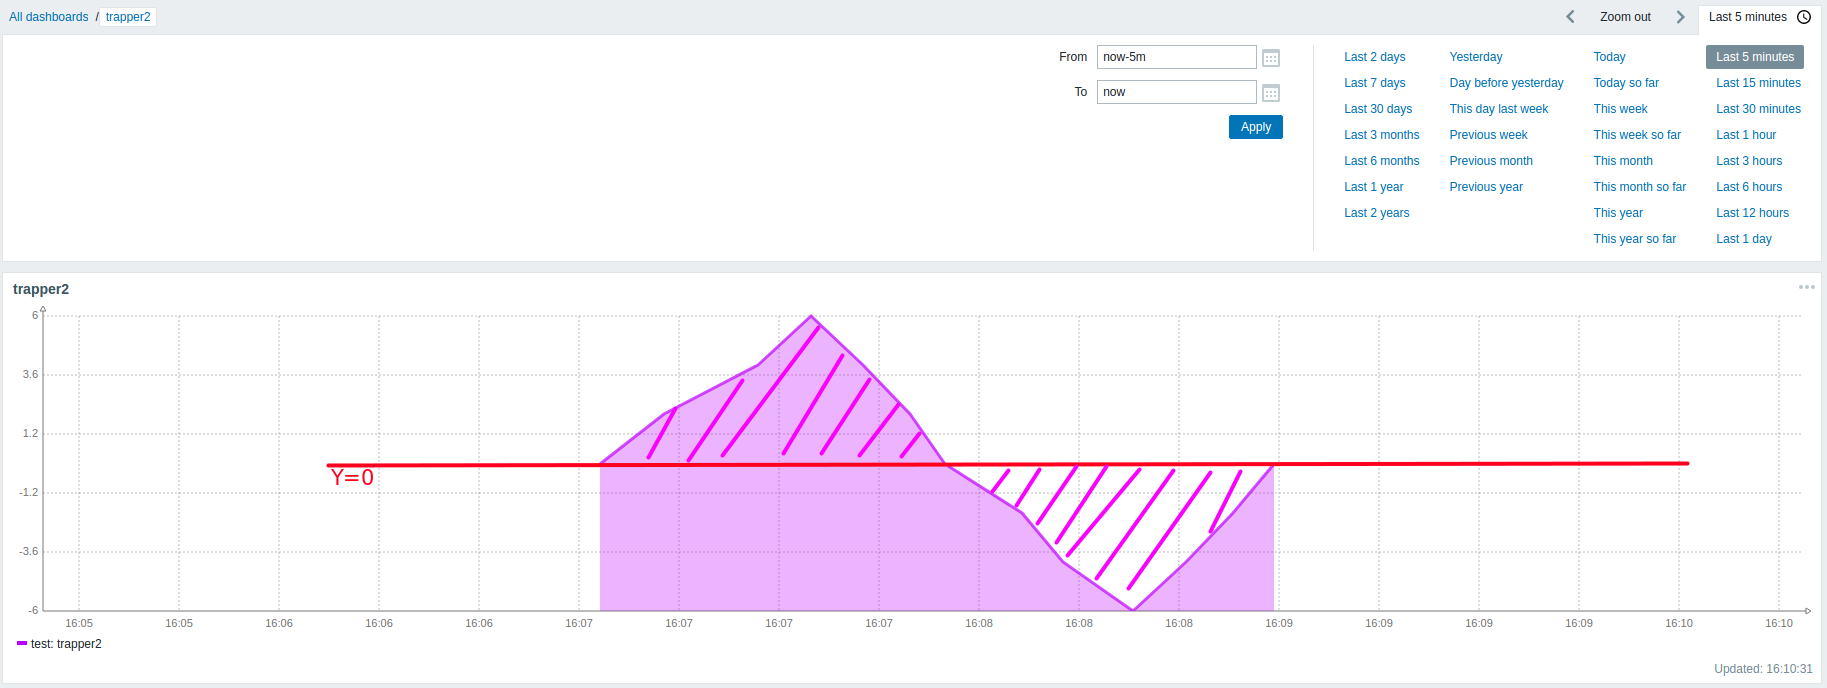
- Options to support missing data. Gaps will be calculated as lack of data exceeding three times average distance between time stamps (the algorithm may be adjusted later on).
- None: leave gap empty
- Connected: connect two border values
- Treat as 0: display as 0 values
- Draw type: Lines, Points, Staircase
- The widget will support the following options:
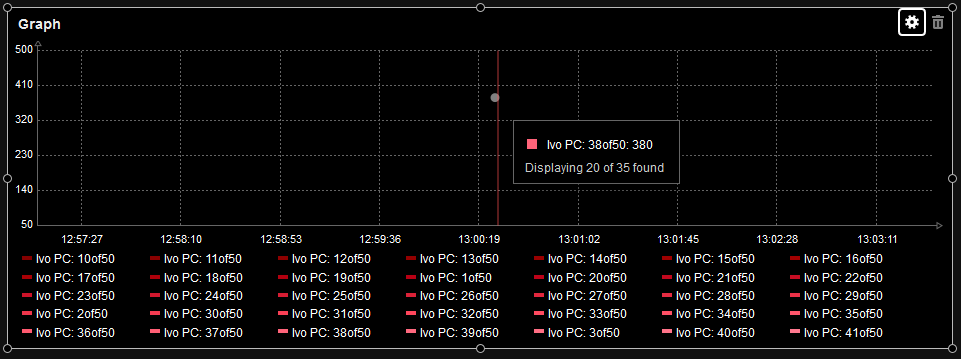
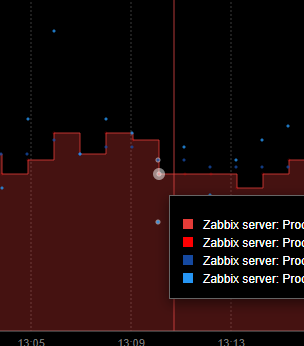
- Legend can be displayed in two modes:
- None: no legend is displayed
- Short (default): short legend is displayed under graph
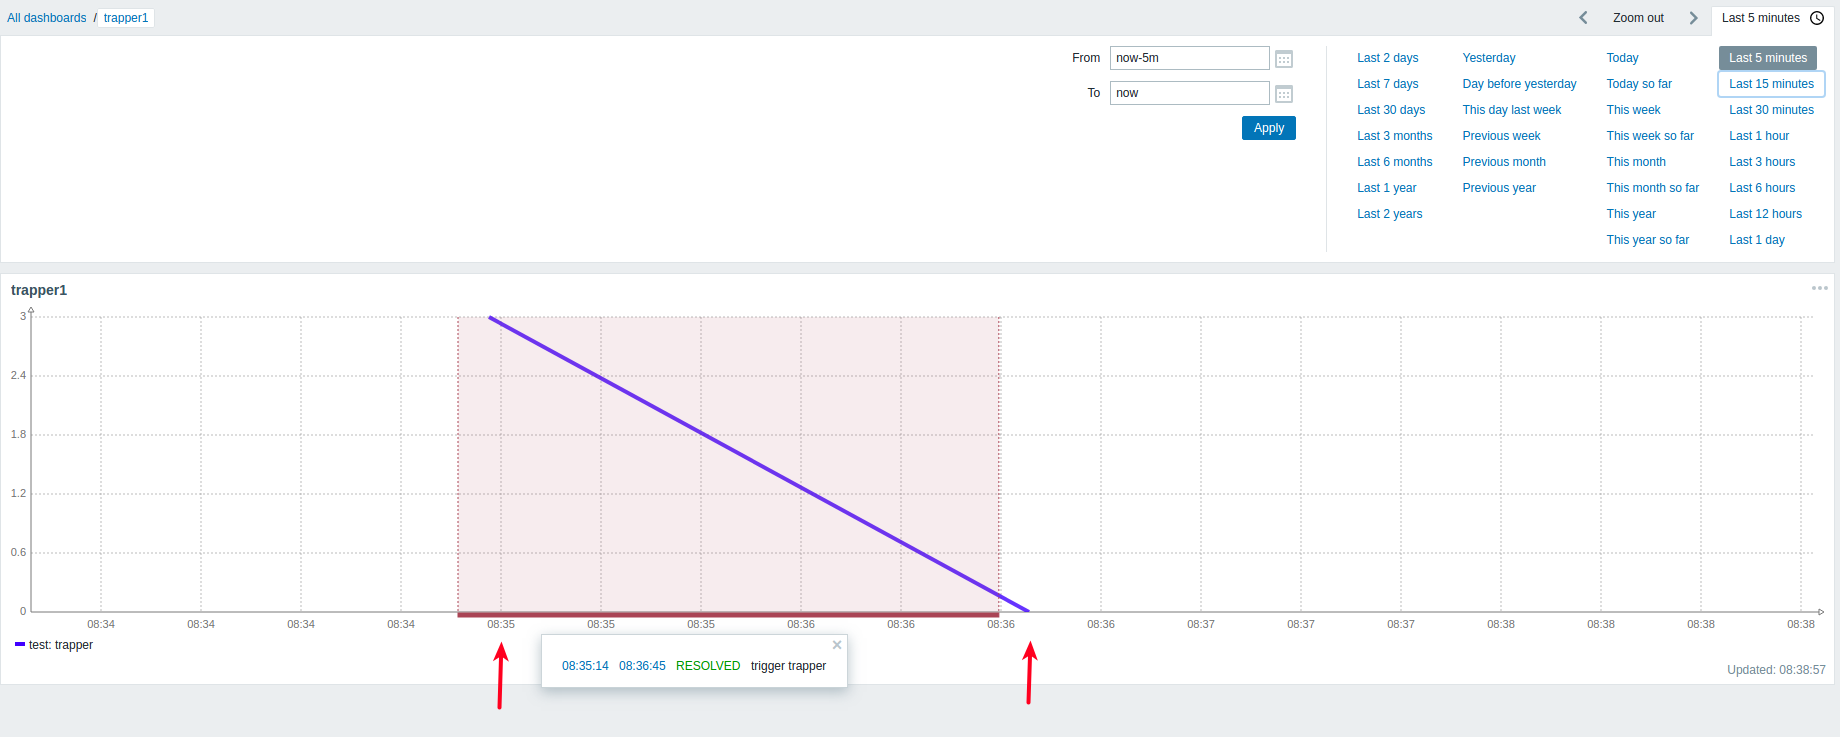
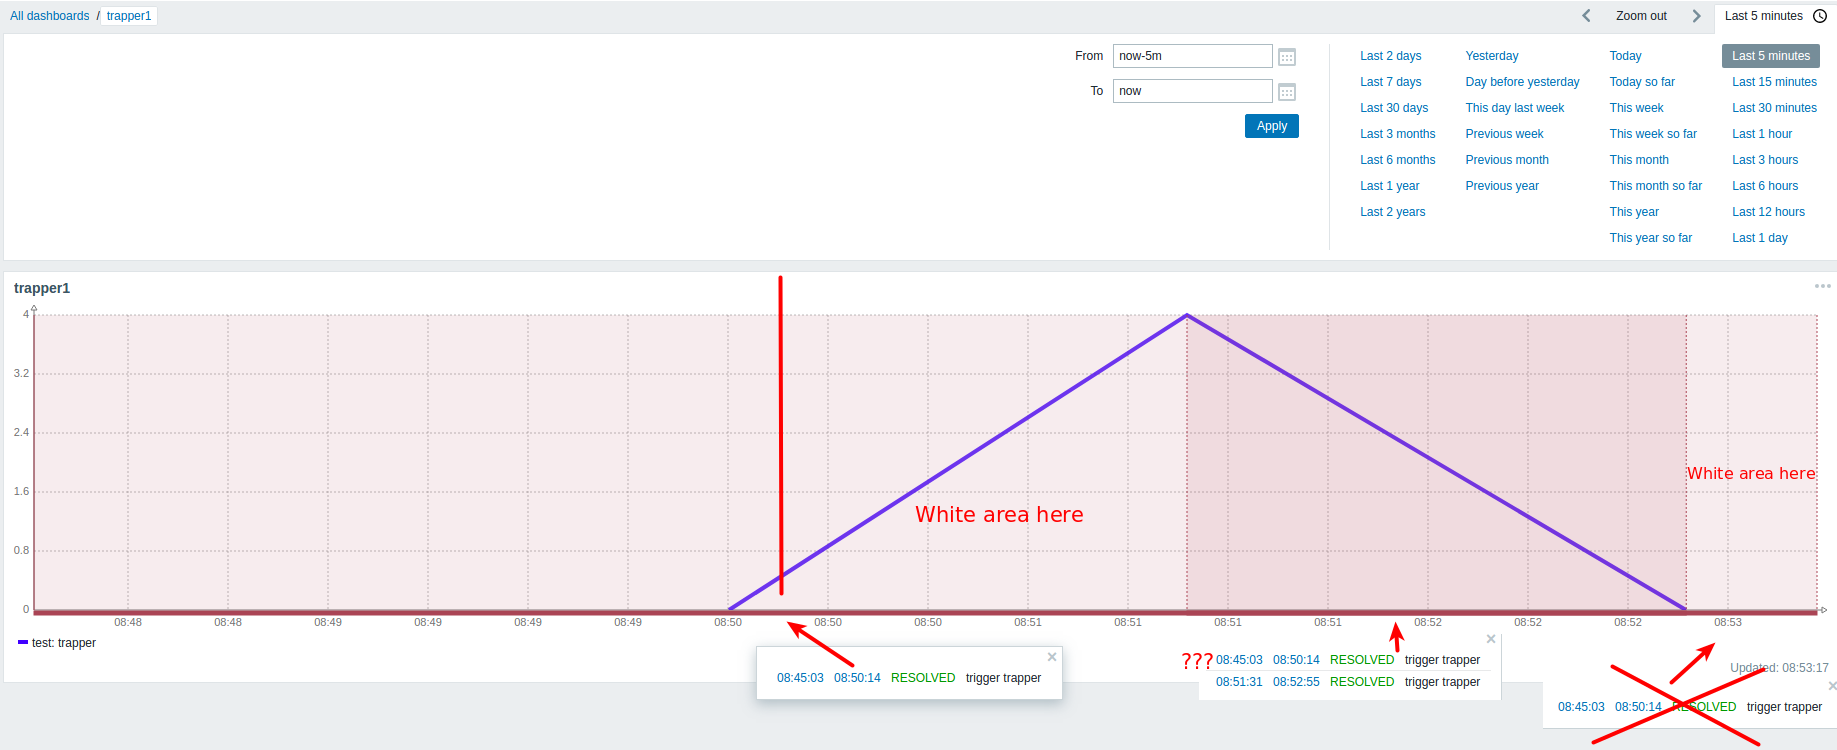
- Ability to select set of problems for displaying as highlighted area using one or more conditions:
- None: no problems displayed
- Selected metrics (default), by host, by severity, by trigger tags (including choice of AND/OR), by problem name.
- Optional attributes for left and right Y axis, per axis:
- Min and max values: calculated (default), fixed value
- Display axis: show (default), hide
- Optional attributes for X axis:
- Display axis: show (default), hide
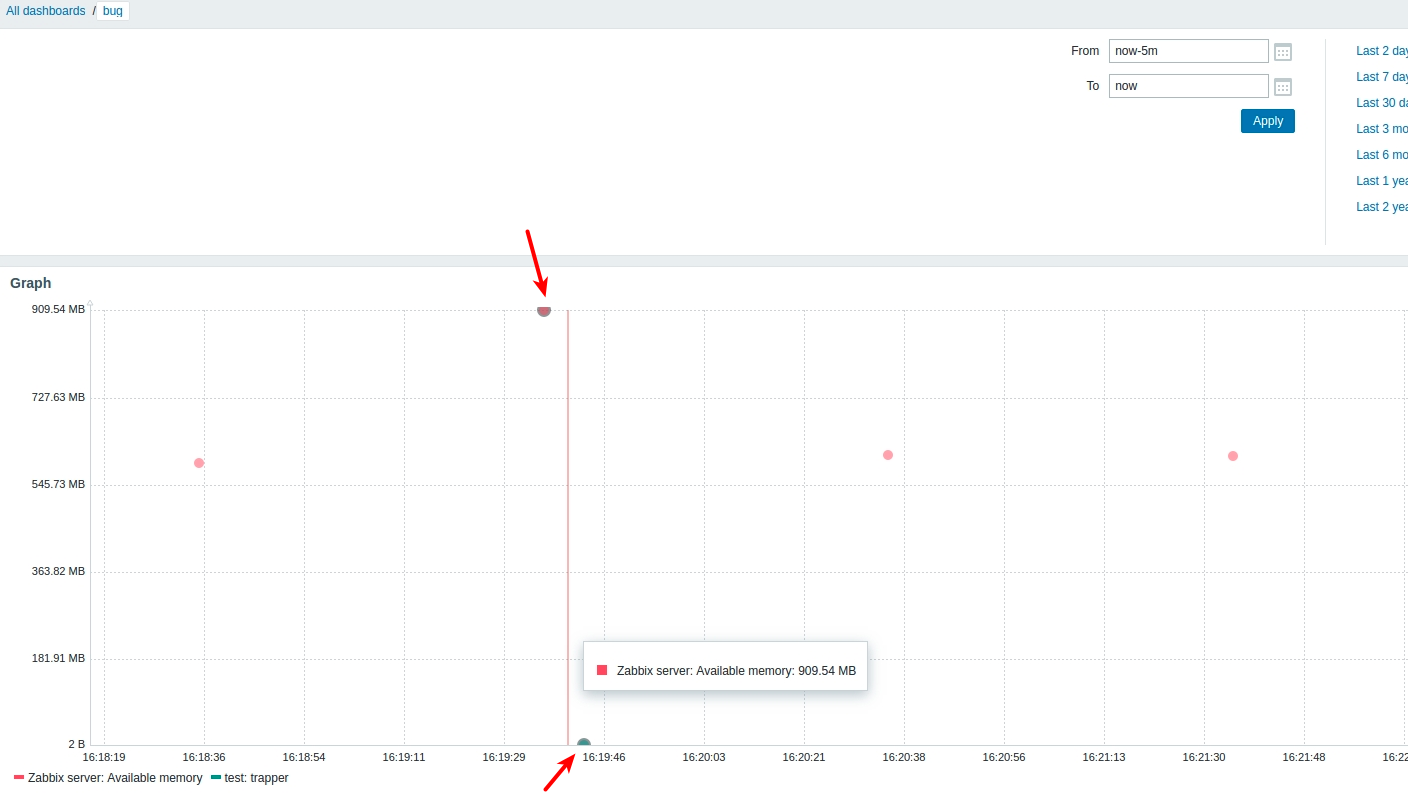
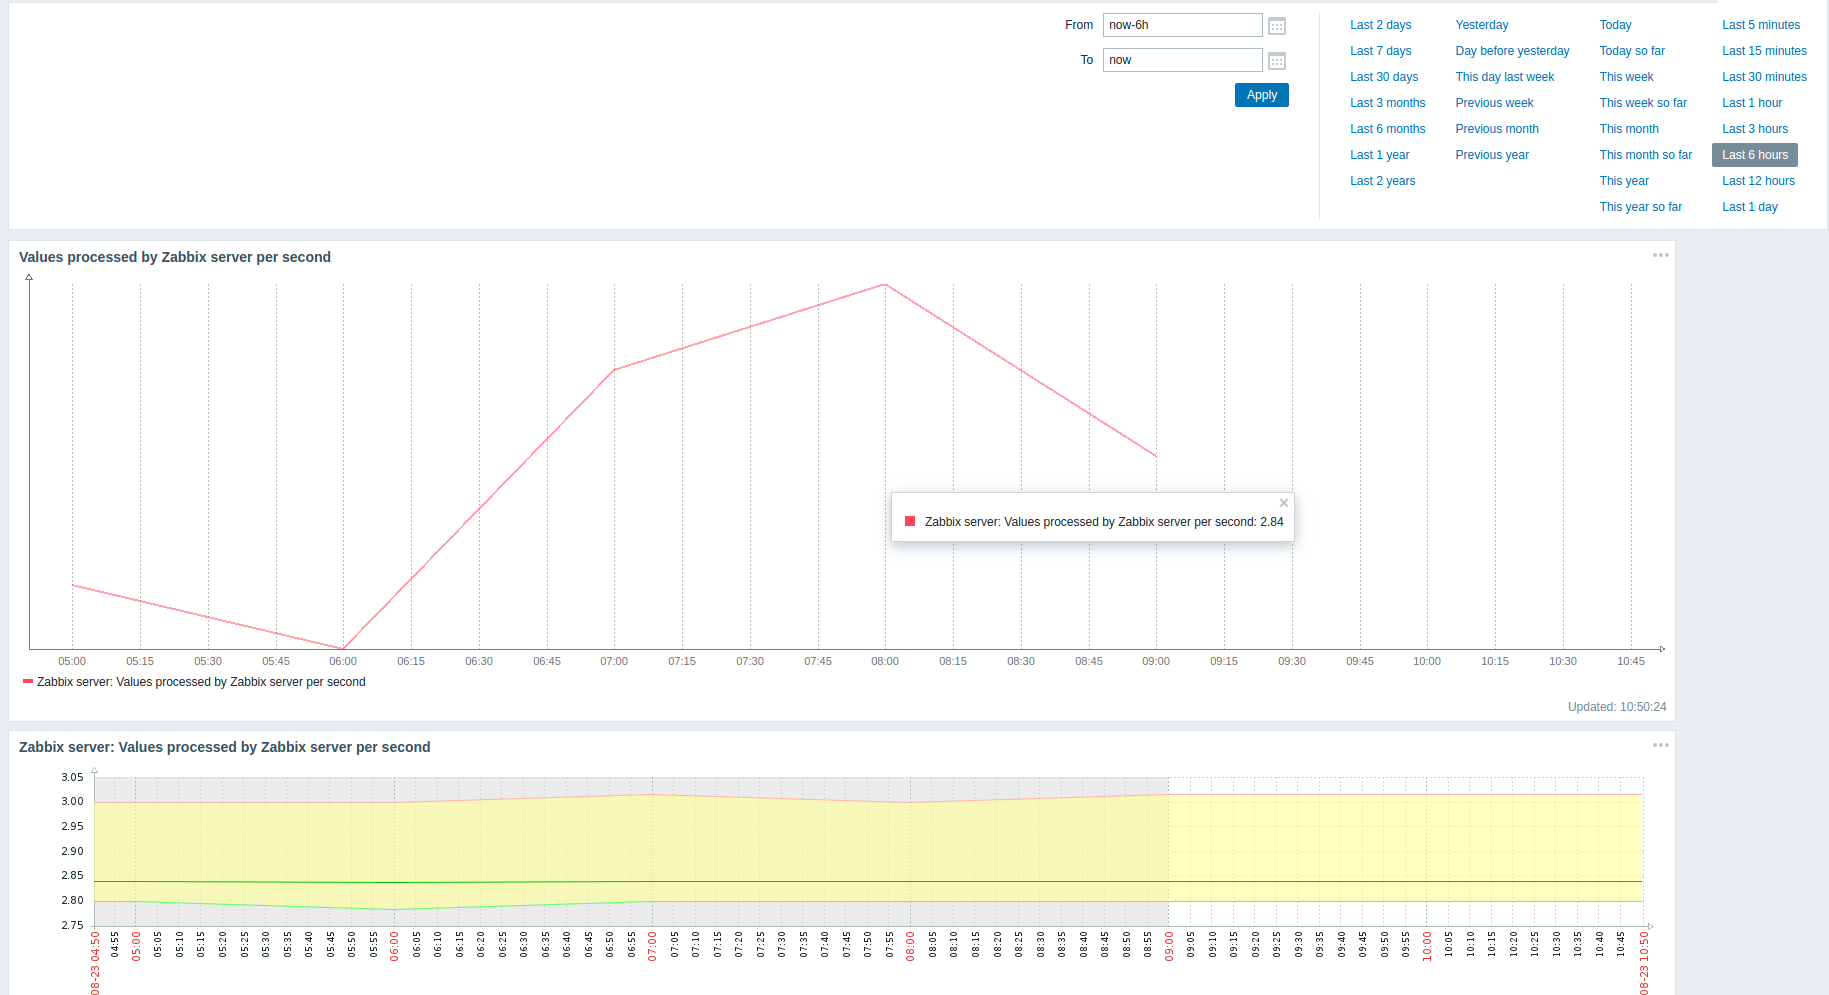
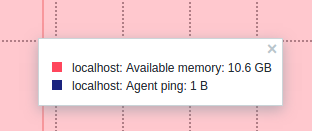
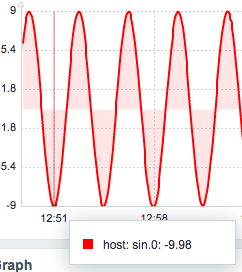
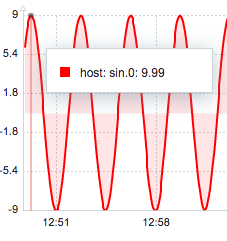
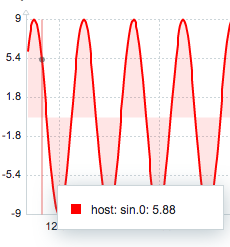
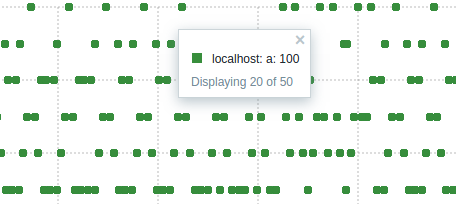
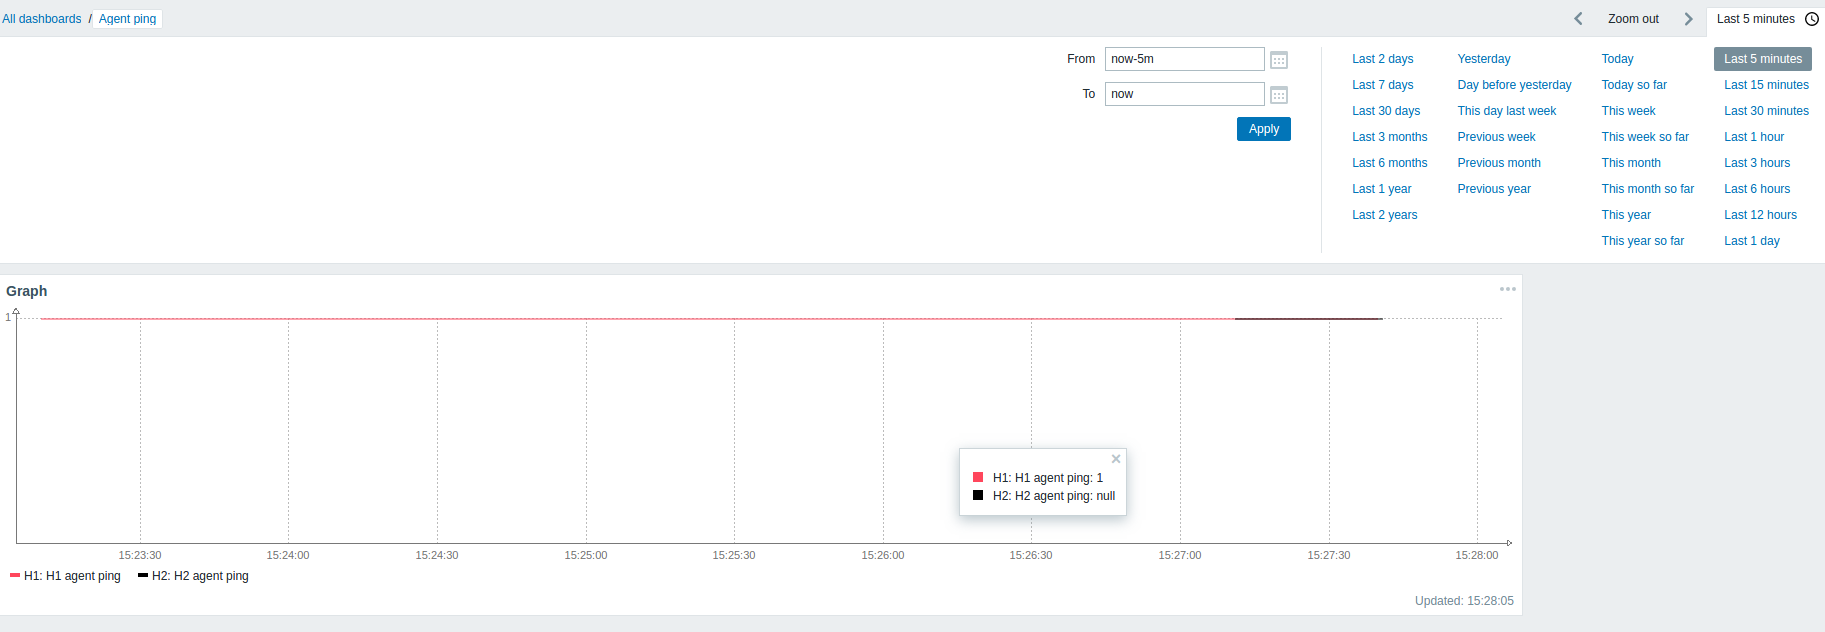
- A tooltip will be display additional information on mouse over:
- Displayed data point: all values for current X coordinate
- Problem area: details of all for the point on area
- Selection of history data:
- Auto (default): automatically as implemented currently
- History: all data is taken from history
- Trends: all data is taken from trends
- Options to display left and right Y axis units, per axis
- Auto: values will be displayed using units of the first item
- Static: overwrite units with given string
- Legend can be displayed in two modes:
Support of macros $1-$9 in item names must be removed in order to make pattern matching work.
The widget configuration form must be optimized for making one-click modifications without forcing users to use hierarchical controls, if possible. That is why, for example, Lines and Staircase made as separate drawing types.
- causes
-
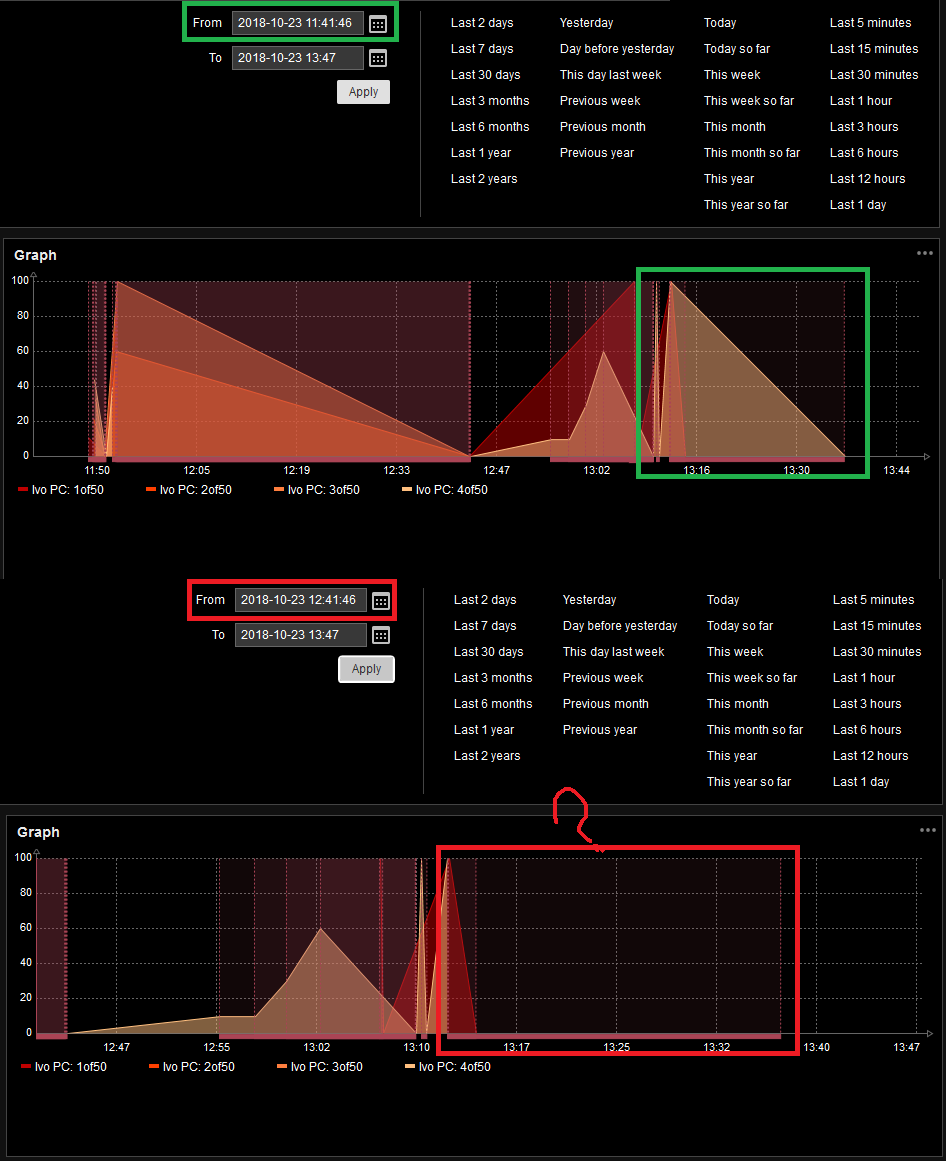
ZBXNEXT-4772 New graph widget zoom requires full page refresh
-
- Open
-
-
-

- Open
-
-
-

- Open
-
-
-
- Reopened
-
-
-
- Closed
-
-
-
- Closed
-
-
-
- Closed
-
-
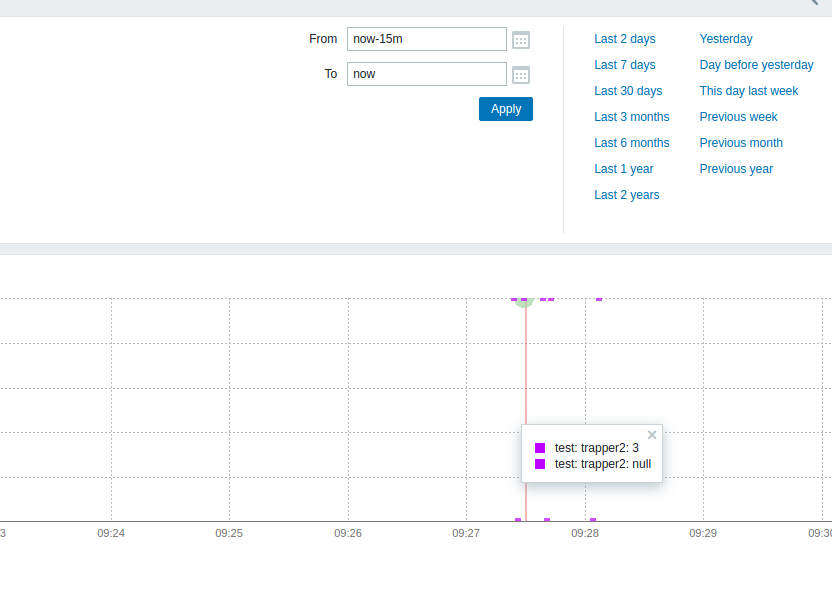
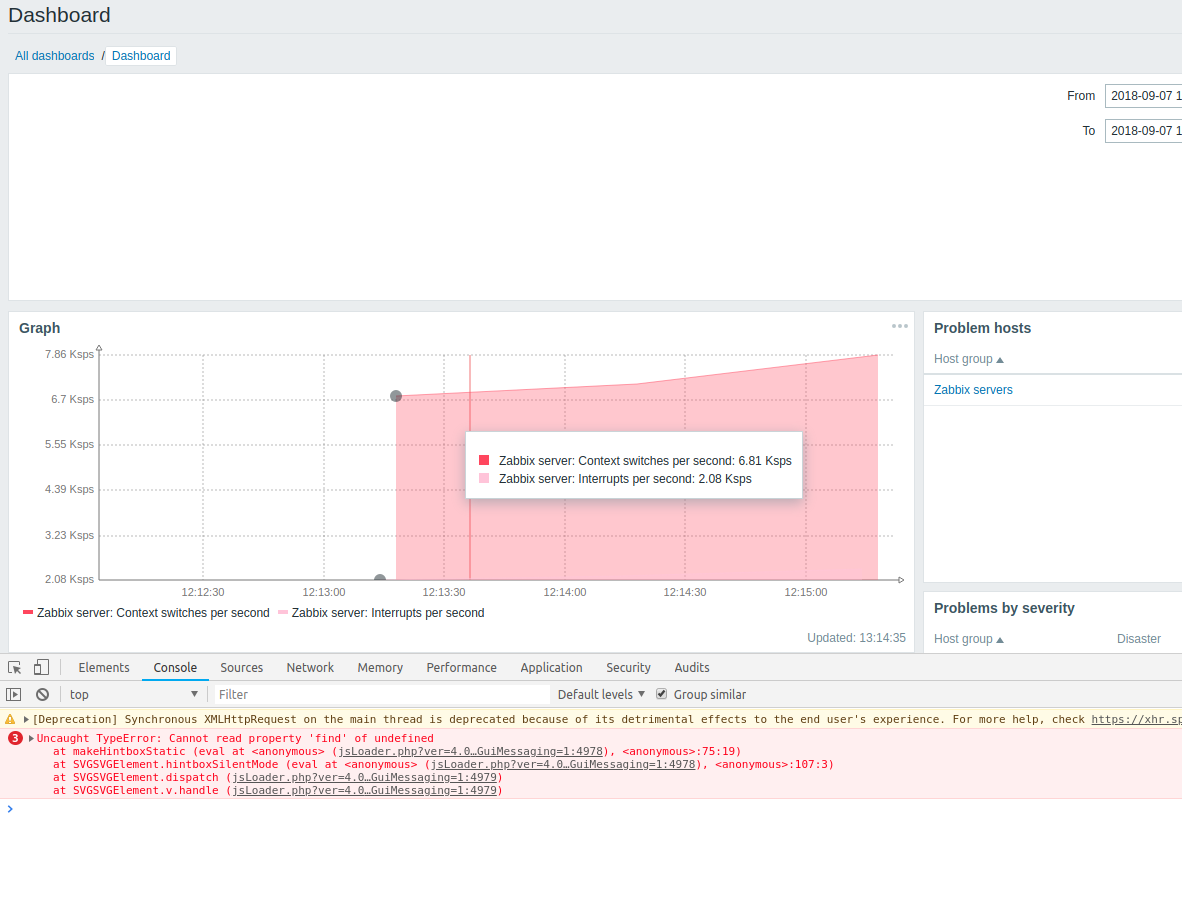
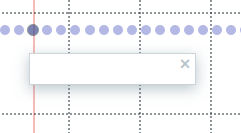
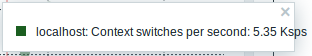
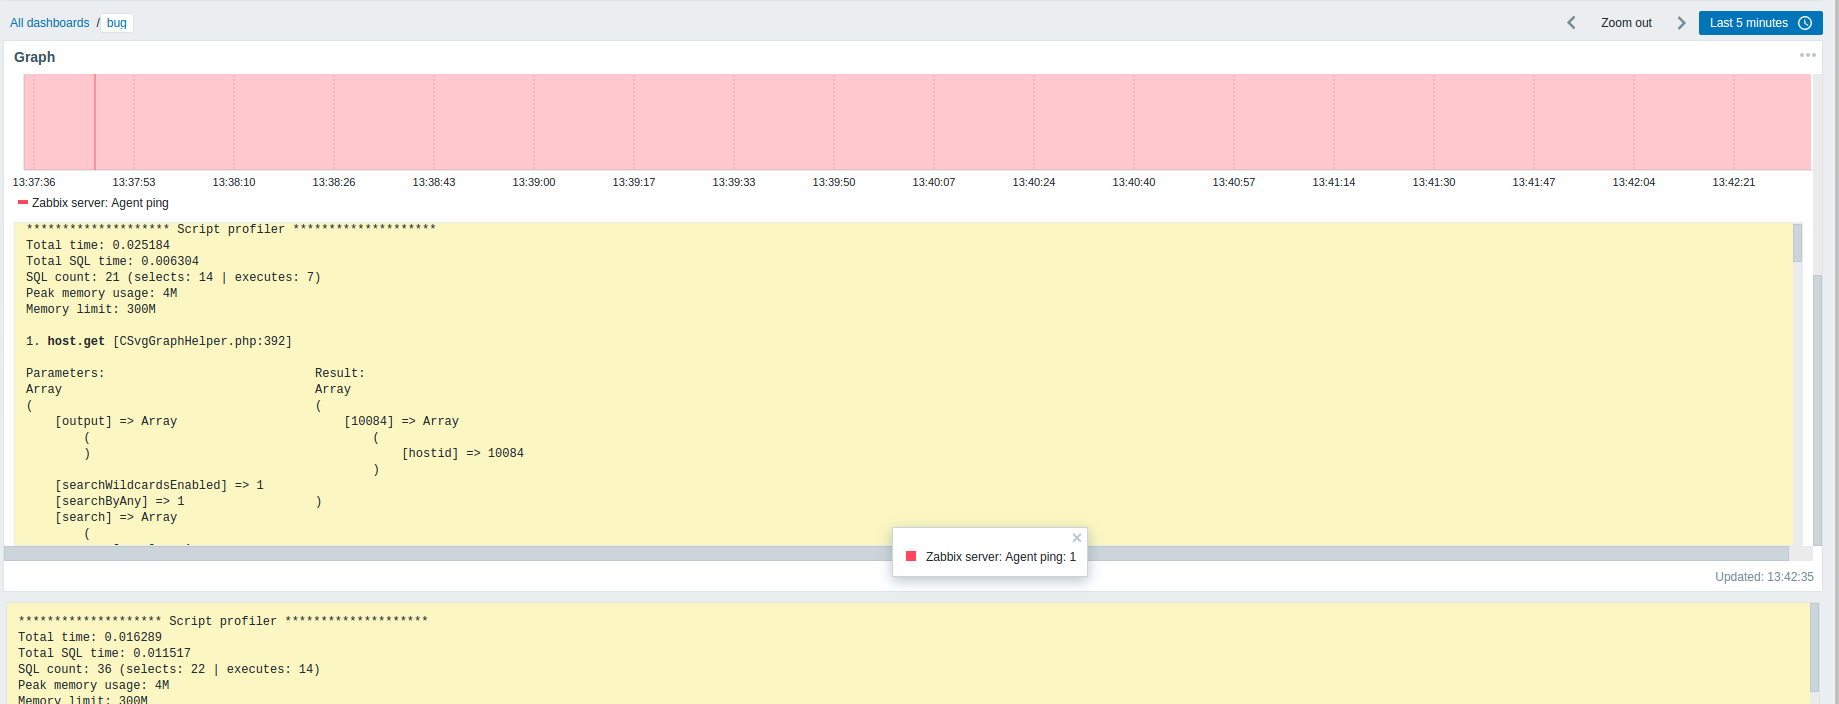
ZBX-15202 SVG graph widget refresh must be paused when opening a tooltip
-
- Closed
-
- depends on
-
-
- Open
-
-
-
- Closed
-
-
-
- Closed
-
- is duplicated by
-
ZBX-14844 Misleading message while creating the Graph widget
-
- Closed
-
- part of
-
-
- Open
-
-
-
- Open
-
-
-
- Open
-
-
-
- Closed
-
-
-
- Closed
-
