-
Type:
Change Request
-
Resolution: Unresolved
-
Priority:
 Minor
Minor
-
None
-
Affects Version/s: 5.0.0rc1
-
Component/s: Frontend (F)
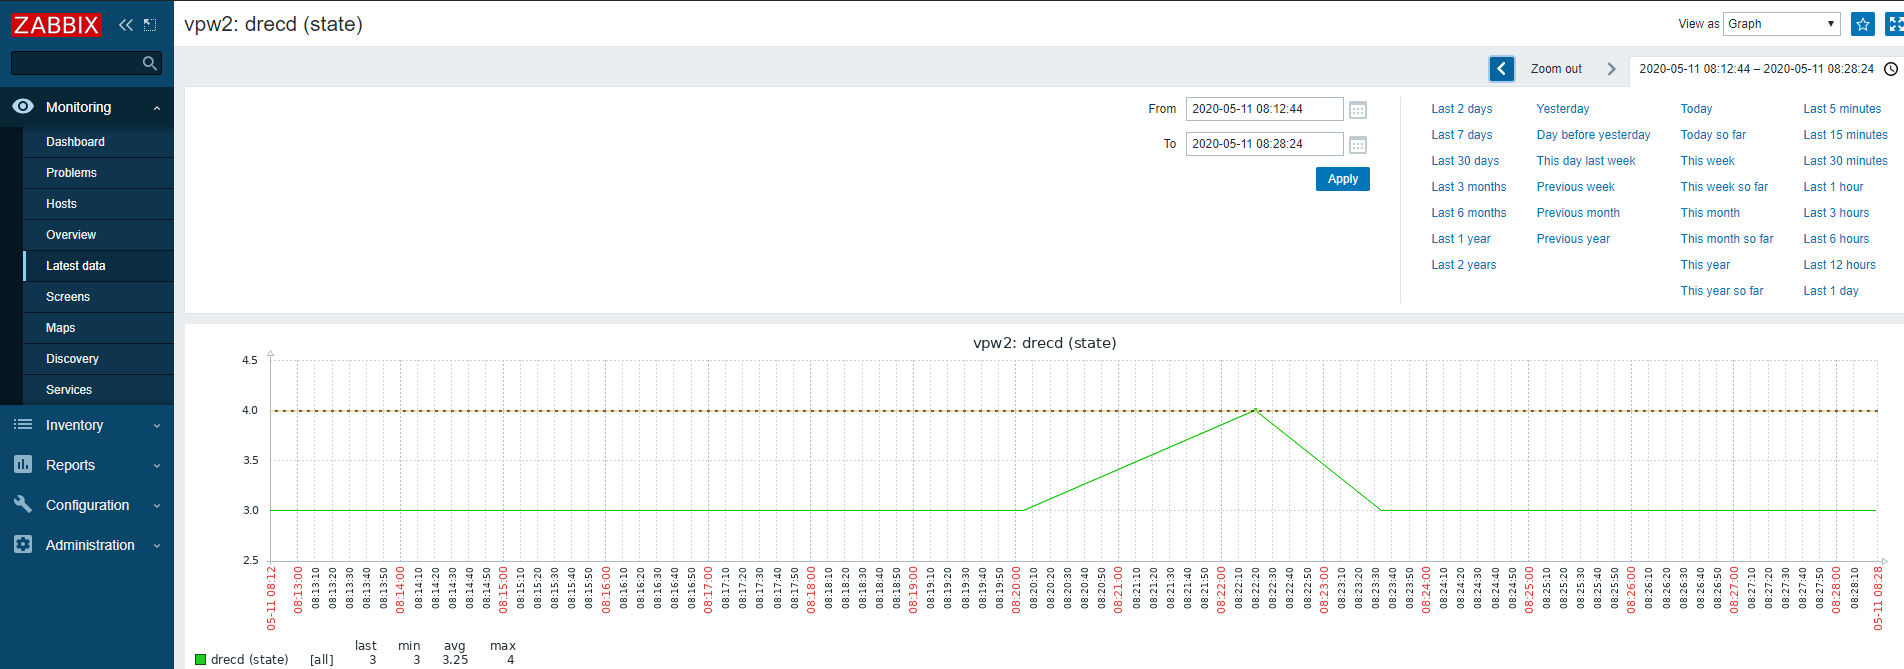
This * feature follows the request ZBX-16162 . Since Zabbix 5.0beta2 the graphs consist of lines connecting all the points from database (heartbeats and stored changes). I'm using Zabbix to monitor state of my applications. State of application is integer value stored in MIB via SNMP protocol on Zabbix host. I've got item configured on Zabbix server which gets this value every 3 seconds with preprocessing step *discard unchanged with heartbeat every 5 minutes. The mechanism of storing data into database works perfectly. But when I want to see history of this item, it is not that intuitive. As seen on picture, when heartbeat is stored every full fifth minute, there is a change in value received (in this picture it is in time 8:22:20). This change it stored in database. Zabbix connects latest heartbeat value and recent change with line, but it is known, that with check every 3 seconds, there was no change until time 8:22:20. So what I would like to see in graph is, that value 3 in goes until time 8:22:17 (latest discarded check) and only then go to value 4. Same would apply in time 8:23:30, where the value of item chaned again.
Just for infomartion, 3 means that application is running and 4 means that application is not running .
Steps to reproduce:
- Configure item on Zabbix host (for example proc.num["some service"]) with interval 5 seconds
- To this item, configure preprocessing step discard unchanged with heartbeat every 5 minutes
- Wait for couple minutes and terminate running service you are monitoring with step 1
- Check graph accessed from Latest data menu
Result:
Latest heartbeat and recent change are connected with straight line.
Expected:
Zabbix knows that item is checked every 5 seconds and there was no change in received value, so it should "calculate" latest discared value in time T (time of change minus *item check interval) and add original value into the graph in time *T. So the change represented in graph is steep.