|
Dear Alex,
I'd like to clarify a few things first:
When you navigate to Screens, do you see the graph portraying the correct data?
And if you go to monitoring>hosts and select a host with the item in question, does the graph show data then, or is it missing information as well?
Trying to narrow the possible causes for this behaviour, hope you understand.
|
|
Yes, the graphs in the screens work as expected.
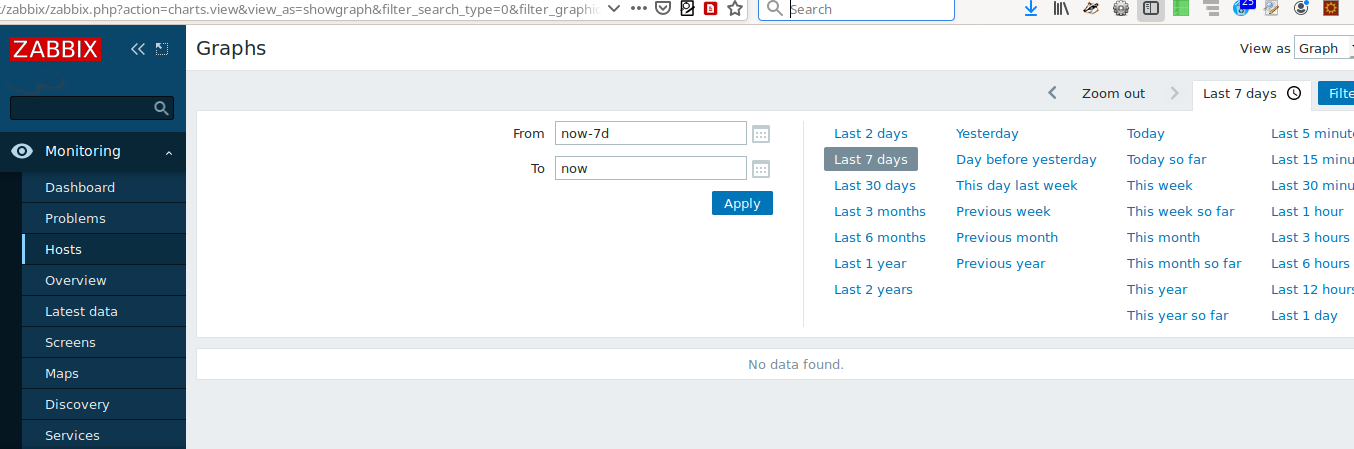
If I navigate to Monitoring > Hosts > [host] > Graphs, I see all the graphs. [example zabbix.php?action=charts.view&filter_set=1&filter_hostids[0]=10277]
|
|
To be clear, the issue affects both host screens and screens created at Monitoring > Screens.
|
|
This is very difficult to replicate, but could you please confirm if on the graph that shows no data found, you switch from graph view to value view, do you see any values there?
Also, please turn on debug mode for your frontend, by adding your user to the "enabled debug mode" and going back to the graph with no data and copy the debug output for us to take a look.
|
|
If I view as values, I see values, but not from the host I was expecting. I clicked on a graph belonging to the host "westogre" and see data from a bunch of other hosts.
OK so perhaps the Filter tab is the key here. In a screen with graphs from various hosts, I click on a graph from host called "westogre". I get "No data found". On the Filter tab I see:
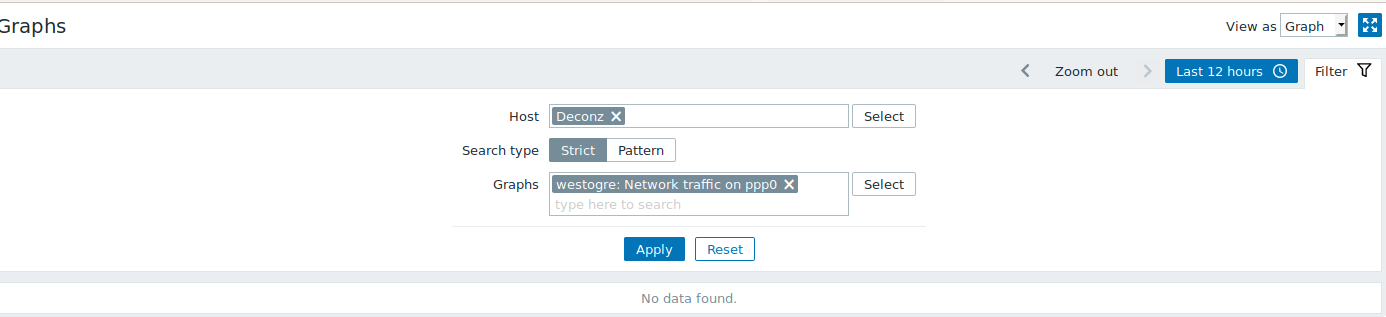 This is never going to work, the two filter options here are mutually exclusive. Remove the Host constraint, I see the graph as expected. Return to the Screen, then click the graph again, still working. This is never going to work, the two filter options here are mutually exclusive. Remove the Host constraint, I see the graph as expected. Return to the Screen, then click the graph again, still working.
So I assume I must have filtered on host Deconz previously? I still consider this a bug, if the design intention of clicking on a graph in a screen is to take the user to that one graph, then the filter should be either ignored or cleared.
|
- First, Monitoring > Hosts > host "dusty" > Graphs
- Then, Monitoring > Screens > click westogre ppp0 graph in Screen, I see this:
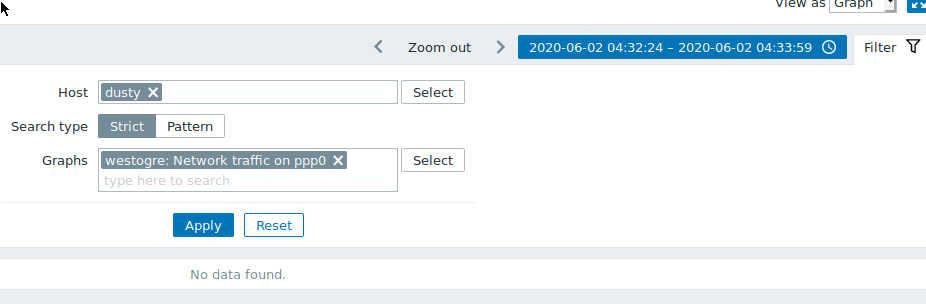
So it looks like remembers the host from my last visit to Graphs via a Hosts screen.
Do you still want the debugging output?
|
|
If it's no trouble, yes, I will communicate with developers to check this.
Will let you know asap.
|
|
Debug output attached, corresponds with most recent screenshot.
|
|
FIXED in development branch feature/ZBX-17853-5.0
|
|
Available in:
|
Generated at Sun Aug 24 22:18:36 EEST 2025 using Jira 9.12.4#9120004-sha1:625303b708afdb767e17cb2838290c41888e9ff0.