|
Problem
'Latest data' view does not load after upgrade from 4.4.7 to 5.0.2 with database server load going from 0.03 (only writes from Zabbix server) to 6.00+ after clicking 'latest data' link - seems to be long-running SELECT query on database
After some troubleshooting, seems to be caused by 2 things:
- Search filter limit initially set to 1000 in 4.4.7 environment (worked perfectly fine)
- New 'latest data' link on Monitoring > Hosts page
Steps below are taken after setting search filter limit to 100 and setting query timeout on database server to 60 seconds
Steps to reproduce:
- Go to https://zabbix/zabbix.php?action=lat...w&filter_rst=1 - loads almost instantly
- Go to some other page (configuration > host groups)
- Go to monitoring > latest data - loads almost instantly
- Within this view, filter for 1 host (no other filters), click apply - loads almost instantly
- Go to some other page (configuration > host groups)
- Go back to monitoring > latest data - loads almost instantly with the last known filters applied
- Go to monitoring > hosts
- Click 'latest data' for a host - starts loading, database load goes up, page never loads (backend timeout)
- Now go to monitoring > latest data - same problem, doesn't load (+ database load)
- Go again to the filter_rst link, works fine again as long as you don't go through monitoring > hosts or increase the system limit for search results
Result:
Database query timeout when clicking 'latest data' in Hosts overview:
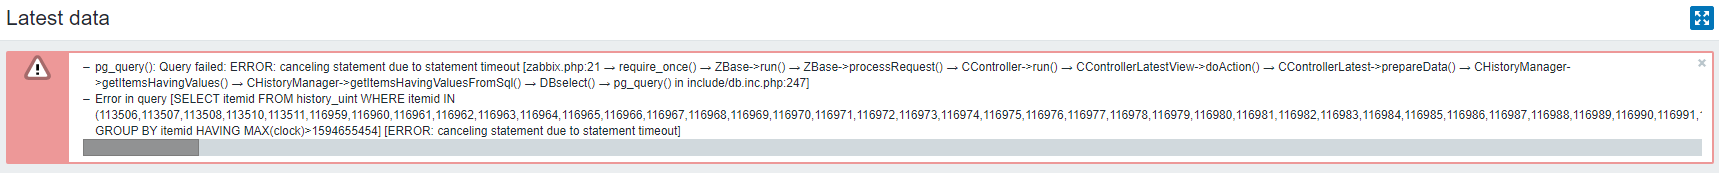
Example of failing query:
SELECT itemid FROM history_uint WHERE itemid IN (113506,113507,113508,113510,113511,116959,116960,116961,116962,116963,116964,116965,116966,116967,116968,116969,116970,116971,116972,116973,116974,116975,116976,116977,116978,116979,116980,116981,116982,116983,116984,116985,116986,116987,116988,116989,116990,116991,116992,116993,116994,116995,116996,116997,116998,116999,117000,117001,117002,117003,117004,117005,117006,117007,117008,117009,117010,117011,117012,117013,117014,117015,117016,117017,117018,117019,117020,117021,117022,117023,117024,117025,117026,117027,117028,117029,117030,117031,117032,117033,117034,117035,117036,117037,117038,117039,117040,117041,117042,117043,117044,117045,117046,117047,117048,117049,117050,117051,117052,117053,117054,117055,117056,117057,117058,117059,117060,117061,117062,117063,117064,117065,117066,117067,117068,117069,117070,117071,117072,117073,117074,117075,117076,117077,117078,117079,117080,117081,117082,117083,117084,117085,117086,117087,117088,117089,117090,117091,117092,117093,117094,117095,117096,117097,117098,117099,117100,117101,117102,117103,117104,117105,117106,117107,117108,117109,117110,117111,117112,117113,117114,117115,117116,117117,117118,117119,117120,117121,117122,117123,117124,117125,117126,117127,117128,117129,117130,117131,117132,117133,117134,117135,117136,117137,117138,117139,117140,117141,117142,117143,117144,117145,117146,117147,117148,117149,117150,117151,117152,117153,117154,117155,117156,117157,117158,117159,117160,117161,117162,117163,117164,117165,117166,117167,117168,117169,117170,117171,117172,117173,117174,117175,117176,117177,117178,117179,117180,117181,117182,117183,117184,117185,117186,117187,117188,117189,117190,117191,117192,117193,117194,117195,117196,117197,117198,117199,117200,117201,117202,117203,117204,117205,117206,117207,117208,117209,117210,117211,117212,117213,117214,117215,117216,117217,117218,117219,117220,117221,117222,117223,117224,117225,117226,117227,117228,117229,117230,117231,117232,117233,117234,117235,117236,117237,117238,117239,117240,117241,117242,117243,117244,117245,117246,117247,117248,117249,117250,117251,117252,117253,117254,117255,117256,117257,117258,117259,117260,117261,117262,117263,117264,117265,117266,117267,117268,117269,117270,117271,117272,117273,117274,117275,117276,117277,117278,117279,117280,117281,117282,117283,117284,117285,117286,117287,117288,117289,117290,117291,117292,117293,117294,117295,117296,117297,117298,117299,117300,117301,117302,117303,117304,117305,117306,117307,117308,117309,117310,117311,117312,117313,117314,117315,117316,117317,117318,117319,117320,117321,117322,117323,117324,117325,117326,117327,117328,117329,117330,117331,117332,117333,117334,117335,117336,117337,117338,117339,117340,117341,117342,117343,117344,117345,117346,117347,117348,117349,117350,117351,117352,117353,117354,117355,117356,117357,117358,117359,117360,117361,117362,117363,117364,117365,117366,117367,117368,117369,117370,117371,117372,117373,117374,117375,117376,117377,117378,117379,117380,117381,117382,117383,117384,117385,117386,117387,117388,117389,117390,117391,117392,117393,117394,117395,117396,117397,117398,117399,117400,117401,117402,117403,117404,117405,117406,117407,117408,117409,117410,117411,117412,117413,117414,117415,117416,117417,117418,117419,117420,117421,117422,117423,117424,117425,117426,117427,117428,117429,117430,117431,117432,117433,117434,117435,117436,117437,117438,117439,117440,117441,117442,117443,117444,117445,117446,117447,117448,117449,117450,117451,117452,117453,117454,117455,117456,123990,124006,124153,124161,124169,124564,124565,124567,124568,125129,125145,125153,125185,125193,125217,125225,125233,125433,125434,125435,125436,125437,125438,125439,125440,125441,125442,125443,125444,125445,125446,125766,125767) GROUP BY itemid HAVING MAX(clock)>1594655454
Other observation:
Expected:
- Normal and responsive 'latest data' loading via both general and hosts views
- Working 'latest data' page with global search limit set to 1000 instead of 100
|
|
Hi, did some further testing today and found that it has nothing to do with 'filter_hostids[0]', but everything with 'filter_show_without_data=1':
"filter_show_without_data=" and "filter_show_without_data=0" are not accepted by Zabbix.
|
|
For cross-reference, this is coming from https://www.zabbix.com/forum/zabbix-troubleshooting-and-problems/405215-latest-data-broken-too-slow-since-upgrade-to-5-0-2
|
|
Hello,
We did an update from Zabbix 5.0.1 to 5.0.2 and we have this problem too. We use the specs Ubuntu 16.04, PostgreSQL and Nginx
|
|
I did an upgrade from Zabbix 5.0.1 to 5.0.2 and I also have this problem.
I am also using a zabbix server with similar specs to the one reported above. nginx,postgresql,Debian
|
|
We have this issue too after upgrade from 5.0.1 to 5.0.2.
|
|
I'm tempted to revert to a snapshot prior to the upgrade to 5.0.2 and wait for this to get sorted out. I'm new to zabbix and I don't have a feeling for how quickly fixes like this are issued.
Is it OK to have 5.0.2 agents reporting to a 5.0.1 server if I revert to the snapshot?
|
Is it OK to have 5.0.2 agents reporting to a 5.0.1 server if I revert to the snapshot?
Absolutely.
|
Absolutely.
Thank you. I reverted back to 5.0.1 for now and I will follow this bug.
|
|
Resolved in development branch feature/ZBX-18071-5.0
|
|
Thank you! Works better.
Noticed that collapsing elements groups is missing
|
|
Thank you for your feedback, vryzhevsky. Glad to hear it's now working better. Collapsing elements were removed within ZBX-17715 task as those were conflicting with paging functionality. Currently we are investigating on alternative solutions for application filtering.
|
|
IMHO grouping is very important functionality, when you have hundreds or thousands items in groups
|
|
Good news, grouping by application is coming back in ZBX-18092.
|
|
Fixed in:
|
|
Are you sure this fixes the issue? I applied the fix from the commit to CHistoryManager.php and PostgreSQL seem to execute the correct statement but it still takes several minutes to execute. It was working fine before upgrading to 5.0.2
query.txt
|
|
Thank you for your feedback, yurtesen. Could you please turn on the debug mode (Administration => User groups => Debug mode) and make sure the mentioned SQL is the one taking that much time to execute?
|
|
averza well I am pretty sure because 1- I can see it hanging in postgresql query list in pg_stat_activity 2- I tried to execute it mysel on zabbix database and it took several minutes to execute.
I am not able to use debug mode because nginx is giving gateway timeout after several minutes when I try to load latest data.
|
|
yurtesen , how many records do you typically have in the history_uint table? Also - could you please execute the same SQL query you mentioned directly in the database with the EXPLAIN keyword before the query? What does it tell? Thank you.
|
|
The query is still extremely slow.
We have quite a few hosts with 1000+ items. DB: postgresql 11 + timescaledb 1.7.2.
A small example:
Query:
Query plan:
Group Key: _hyper_2_1464_chunk.itemid
-> Merge Append (cost=1.15..245105.30 rows=226306 width=8)
Sort Key: _hyper_2_1464_chunk.itemid
-> Index Only Scan using _hyper_2_1464_chunk_history_uint_1 on _hyper_2_1464_chunk (cost=0.57..139175.09 rows=131971 width=8)
Index Cond: ((itemid = ANY ('{72864,80600,80601,80602,80603,80604,80605,80606,80607,80608,80609,80610,80611,80612,80614,80617,80619,80620,80622
,80623,80625,80628,80630,80631,80632,80634,80635,80636,80637,80640,80641,80643,80644,80646,80651,80652,80653,8065480655,80657,80658,80659,80660,80661,80662,80
667,80668,80670,80673,80675,80676,80677,80678,80679,80680,80681,80683,80684,80686,80688,80689,80690,80691,80692,80693,80694,80696,80699,80701,80702,80704,8070
5,80707,80710,80712,80713,80714,80716,80717,80718,80719,80722,80723,80725,80726,80728,80733,80734,80735,80736,8077,80739,80740,80741,80742,80743,80744,80749,8
0750,80752,80755,80757,80758,80759,80760,80761,80762,80763,80765,80766,80768,80770,80771,80772,80773,80774,80775,80776,80777,80778,80779,80780,80781,80782,807
83,80784,80785,80786,80787,80788,80789,80790,80791,80792,80793,80794,80795,80796,80797,80798,80799,80800,80801,183765,183767,183768,183774,183775,183776,18378
2,183783,183784,183786,183787,183788,183790,183799,183800,183801}'::bigint[])) AND (clock > 1595770706))
-> Index Only Scan using _hyper_2_1459_chunk_history_uint_1 on _hyper_2_1459_chunk (cost=0.57..103667.14 rows=94335 width=8)
Index Cond: ((itemid = ANY ('{72864,80600,80601,80602,80603,80604,80605,80606,80607,80608,80609,80610,80611,80612,80614,80617,80619,80620,80622
,80623,80625,80628,80630,80631,80632,80634,80635,80636,80637,80640,80641,80643,80644,80646,80651,80652,80653,8065480655,80657,80658,80659,80660,80661,80662,80
667,80668,80670,80673,80675,80676,80677,80678,80679,80680,80681,80683,80684,80686,80688,80689,80690,80691,80692,80693,80694,80696,80699,80701,80702,80704,8070
5,80707,80710,80712,80713,80714,80716,80717,80718,80719,80722,80723,80725,80726,80728,80733,80734,80735,80736,8077,80739,80740,80741,80742,80743,80744,80749,8
0750,80752,80755,80757,80758,80759,80760,80761,80762,80763,80765,80766,80768,80770,80771,80772,80773,80774,80775,80776,80777,80778,80779,80780,80781,80782,807
83,80784,80785,80786,80787,80788,80789,80790,80791,80792,80793,80794,80795,80796,80797,80798,80799,80800,80801,183765,183767,183768,183774,183775,183776,18378
2,183783,183784,183786,183787,183788,183790,183799,183800,183801}'::bigint[])) AND (clock > 1595770706))
(8 rows)
Yesterday's chunk has 251 million rows in history_uint:
count
-----------
251618040
(1 row)
The query scans indexes for two last chunks (today + yesterday). Opening the 4301 items host is impossible; The query will hang for over 5 minutes (at which php execution time limits kick in).
The same thing should happen on any db with any kind of partitioning.
|
|
averza I have psql 12.2 with timescaledb 1.7.2
`history_uint` table has 164614857 rows.... not sure if it is more than usual or not...?
With explain, I get something like:
 Group (cost=207040303.57..207061521.88 rows=200 width=8)
 Group Key: _hyper_2_671_chunk.itemid
 -> Gather Merge (cost=207040303.57..207061521.38 rows=200 width=8)
 Workers Planned: 1
 -> Group (cost=207039303.56..207060498.87 rows=200 width=8)
 Group Key: _hyper_2_671_chunk.itemid
 -> Sort (cost=207039303.56..207049901.22 rows=4239063 width=8)
 Sort Key: _hyper_2_671_chunk.itemid
 -> Parallel Append (cost=108530.70..206504790.14 rows=4239063 width=8)
 -> Parallel Bitmap Heap Scan on _hyper_2_671_chunk (cost=108530.70..124960673.58 rows=2659992 width=8)
 Recheck Cond:
So... can't this be reverted back? It was working very nicely before 5.0.2...
|
|
Here's a copy of an explain of the query we're discussing on my system. It seems to take about 10 seconds to execute, so not terribly long (and not nearly as long as some of the other slow Zabbix queries I'm experiencing in 5.x):
MariaDB [zabbix_prod]> EXPLAIN SELECT itemid FROM history WHERE itemid IN (170927,170928,170975,172834,172835,172836,172837,172838,172839,172840,172841,172842,172843,172844,172845,172906,172907,172908,172909,172910,172911,172912,172913,172914,172915,172916,172917,207614,207615,207626,207627) GROUP BY itemid HAVING MAX(clock)>1595803513;
-----
| id | select_type | table | type | possible_keys | key | key_len | ref | rows | Extra |
-----
| 1 | SIMPLE | history | range | history_1 | history_1 | 8 | NULL | 3980 | Using where; Using index for group-by |
-----
|
|
Hi, jameskirsop. This has been fixed within this branch. You can either wait for the next 5.0.3rc1 / 5.2.0alpha1 release or just apply the commits mentioned in "fixed in" comment.
|
|
yurtesen, thank you for the provided information. Could you please also check if the performance issue persists when "Show items without data" checkbox is checked.
|
|
averza again, are you sure it is fixed? as I mentioned it does not seem to help?
You know it was NOT easy to check the show items checkbox because the page never loaded. I had to give it as URL parameter. But then PHP ran out of memory (default was 128M) this never happened before 5.0.2. I increased the memory limit and loaded latest items. It was still working somewhat slow with the "Show items without data" checkbox checked. In the past it opened much faster.
Then I tried the debug mode... it froze my browser for a while... not surprised why php ran out of memory...
******************** Script profiler ********************
Total time: 1.846662
Total SQL time: 1.067919
SQL count: 1031 (selects: 1028 | executes: 13)
Peak memory usage: 167M
Memory limit: 256M
Do you want me to test more things? Because I am thinking of downgrading to an older version right now.
|
|
Hi, yurtesen. I must agree that the previous versions worked faster, but there were issues (like missing data, mentioned in ZBX-17715). Will you agree, that doing things right and fast is challenging, but that's the only acceptable strategy? You mentioned previously that selection of data while filtering only items with data is significantly slower on your system. Thank you very much for testing this specific case. We will check how this can be improved.
|
|
averza in issue ZBX-17715 OP also says "Before Zabbix 5.0 that problem didn't exist". I do not know what happened in between. But it sounds like something was changed which caused a problem. Then the fix for ZBX-17715 introduced significantly more resource usage?
I do not claim to know the best way to resolve this issue. But I would rather have performance over feature where possible. Nowadays people are used to fast response times. You will end up people choosing solution X which is more responsive than Zabbix, even if that solution X has a fraction of the features that Zabbix provide. Maybe unreasonable but that is how people are 
Anyway, hopefully this issue gets fixed...
|
|
There are many issues like that and all of them are because of the need for frontend to get data from history tables, which is usually really slow.
Before 2.2 Zabbix wasn't using history tables to view "Latest data". The latest values of each item were stored in items table. This allowed quick view of latest data but it caused big issues when handling configuration internally.
Thus, in Zabbix 2.2.0 these columns were removed from items table. Since then, "Latest data" is fetched from history tables and that proved to be slow and resource consuming on non-small installations (e. g. see ZBXNEXT-2013).
One of the solutions to fix this issue once and for all, to introduce special tables (lastvalue_*), is explained here. And it actually was tested and proved working on one big setup.
|
|
dimir the solution you suggest is interesting and seems helpful but it sort of duplicates some data... For this specific case the biggest problem is when zabbix is trying to find non-empty items. It executes something like
select itemid from history_uint where (itemid in (72864,80600,...MANY ITEMIDS...)and clock > 1595770706) group by itemid;
It does not even fetch the data for these items... and it takes long time because of group by on postgresql,, perhaps mysql works faster? maybe related to this... https://wiki.postgresql.org/wiki/Loose_indexscan
I hope this gets somewhat fixed in 5.0.3 at least...
|
|
yurtesen, for the record we used to have this duplication before (in the items table) and there was no such issue.
As to non-empty items, specifically for this case the solution was proposed. Latest data page does not care about any other than the latest value.
The biggest problem in that query you mention is the amount of records that need to be processed. In the proposed solution there is exactly 0 or 1 record affected, thus, the results are returned instantly.
|
|
A patch for Zabbix version 5.0.2 is available: patch_for_5.0.2.patch. To install, please download the file into the root or frontend directory of Zabbix and execute the following command:
git apply patch_for_5.0.2.patch
|
|
Hi, I've just applied the patch. However, it seems like, by navigating the sidebar, clicking Monitoring > Latest Data tries to load the page but fails with an error 500.
Here's the error I'm getting in the apache error_log.
[Thu Aug 06 11:30:04.504373 2020] [proxy_fcgi:error] [pid 51080] [client 192.168.142.214:62151] AH01071: Got error 'PHP message: PHP Fatal error: Allowed memory size of 268435456 bytes exhausted (tried to allocate 20480 bytes) in /usr/share/zabbix/include/classes/api/CApiService.php on line 288\nPHP message: PHP Fatal error: Allowed memory size of 268435456 bytes exhausted (tried to allocate 20480 bytes) in /usr/share/zabbix/include/func.inc.php on line 1071\n'
{{}}
We tried to increase the PHP memory from 256M to 1G in the Zabbix GUI configuration, but this only gave us a 503 instead of a 500.
|
|
Hi, stefano.mendola. HTTP code 503 is possibly related to wrong server configuration. Are you sure the web server is up and running after you updated the configuration?
|
|
Hi Andrejs, yes, the web server was up and running.
What we exactly experienced and did was:
- Instant error 500 when clicking Monitoring > Latest data
- Applied the patch
- Instant error 500 persists
- Increased the PHP memory from 256M to 1G
- Clicking Monitoring > Latest data, the query starts, the page tries to load and finally returns a 503.
In this whole process Apache was up and running.
|
|
The patch won't fix it because I tried that before I even found the bug.
The 503 error is fast cgi/proxy timeout to PHP-FPM and this happens because the quries (several) are taking longer than the PHP timeout. I have set PHP execution timeout and proxy timeout and http connection timeout up to 15min and it still is too slow. >15 to get last data.
It is not one query, it seems to run different queries in succession, so like a endless loop
|
|
Hello, Can you rollback "latest data" functions to work the same like in 5.0.1?
|
|
Hello, Kendzens! Unfortunately we cannot revert "latest data" to 5.0.1 since there were issues with incomplete data selection. Instead we are aiming to achieve both correctness of the displayed data and good performance as well.
Could you please try patch_for_5.0.2_v2.patch (created for 5.0.2 release)?
Note that the previous patch must be uninstalled first.
git apply -R patch_for_5.0.2.patch
git apply patch_for_5.0.2_v2.patch
|
|
Hello Andrejs - since closing ZBX-18201, should this patch be applied in my situation as well? Though similar error from Latest Data (PHP memory exhausted), issue presents differently than a slow query timeout cause? Only presents HTTP 500 when 'reset' the page to no filters.
|
|
Hi, Xponet. PHP memory issue will hopefully be resolved, if you apply the patch.
|
|
A patch v2.1 is available for testing.
Note that the previous patches must be uninstalled first.
git apply -R patch_for_5.0.2_v2.patch
git apply -R patch_for_5.0.2.patch
git apply patch_for_5.0.2_v2.1.patch
|
|
Don't see v2.1 patch, also this applies to mariadb backend as well?
|
|
I have applied the patch_v2, and I was at least able to see the Monitoring > Latest data on itself, but as soon as I filtered for an host with roughly 3000 items, the query is still slow and ends up with a 503. Still, ticking the "Show items without data" has the effect of making the query 700% faster.
Then I applied the patch_v2.1 and I'm again unable to load the Monitoring > Latest data page on itself. Slow query that ends up with a 503, same as we experienced before the patch_v2.
|
|
Hi stefano.mendola. Thank you for your feedback. As you have already noticed, Latest data is working good when "Showing items without data" (the default state). However, filtering data with values is quite a challenge on hosts with thousands of items, taking into account that some stats are needed to render the list. Nevertheless, the patch v3 will address this exact issue. Please stay tuned.
|
|
Xponet, yes, the patch is independent from the database type.
|
|
I applied the patch to our scenario - it does fix the HTTP 500 error - but again the expected 'clear' state (blank page) for all filters on Latest Data is showing all hosts 'based on limit of 1000 returns" from global settings.
I even reverted back to global 5000 rows, page loads but not blank (as expected from previous versions) when hitting reset.
|
|
Hi, Xponet. Glad to hear the page is now loading even with the increased number of rows. Please note that the requirement to setup some filtering prior to displaying the data was removed in version 5.0.
|
|
Hello -
I understand the new 'work flow of 5.0 to Monitoring -> Hosts -> Latest Data for that host. But to have to apply filters on Latest Data directly or load all hosts seems 'backwards' to logic, especially to existing users upgrading. If there is underlying code for this change then it seems removing 'Reset' from the page would force this logic for all users. Though makes more sense to revert to 'clearing' filters if possible, especially sense this loading all hosts was causing our HTTP error? My 2 cents but thank you for the quick patch/fix.......
|
|
+1 to Xponet
Showing everything when no filters are set, is just weird and not intuitive IMHO.
|
|
Hi! Imagine a simple setup where there are just several hosts with several items. In such situation what would the reason be not to show all the latest data grouped by hosts and applications?
|
|
I think there should be the possibility to configure this option (maybe under Administration > General).
It's not 100% sure that every scenario is suitable with this "showing everything with no filters" option IMHO.
|
|
Adding it as an option/preference would be nice middle ground/workaround. Even adding logic to load only active hosts? As our deployment is static and dynamic so not all hosts are monitored all the time (as our deployment is nearly 7000 total hosts). 'Reset' inherently implies clear and start fresh, regardless of deployment size. As Marco stated, its intuitive for clearing filters, especially being an existing user(s).
|
|
Hi averza! You argument is correct and valid. But Zabbix has made clear in the past, with several designs decisions, that they design Zabbix Frontend for large systems in mind.
For example, the replacement of dropdown filters with Multi-Select textboxes. That was a clear statement towards large environments.
Another example is stated in the official docs for 5.0: https://www.zabbix.com/documentation/current/manual/introduction/whatsnew500#managing_large_numbers_of_hosts
Based on that I find it wired, that in a large environment, Latest data without filters shows all. It doesn't fit to the rest of the argumentation.
stefano.mendola I don't think that's necessary IHMO.
|
|
Showing everything sounded always weird to me too. IMO this would work in 2 cases:
- having something like "Favourite hosts", by default that could be "Zabbix server" (which as I understood is still used in production environments)
- showing real "latest data", e. g. last 100 values received by the server (but in this case pagination doesn't make sense)
|
|
As averza mentioned, it all would be much easier if we'd know which items have recently received new values. We have table item_rtdata that is used to store log monitoring related data:
That would be extended to have additional column e. g. lastclock, that would contain the timestamp of the latest value received and would be updated by history syncer. Showing latest data in this case would be much less resource consuming:
|
|
IMHO This query is slow because of the WHERE itemid IN (....) clause, not the GROUP BY, or anything else.
This WHERE clause results in a full index scan - in the worst case it will read the whole index in and check each row and that's what the EXPLAIN output tells us (looking at the data by Yaroslav Dronskii):
Index Only Scan using _hyper_2_1464_chunk_history_uint_1 on _hyper_2_1464_chunk (cost=0.57..139175.09 rows=131971 width=8)
cost=0.57..139175.09 / rows 131971 means that it will do anywhere between a few reads - if all specified itemids happen to be in the first pages - to many many reads - which would be all the rows of the table if the itemids are at the end - and it expects 140k rows as a result of the scan. It is only the index - 8 bytes per row - but at 250M that the table has, it makes about 2G read from the disk and if itemids are let's say 50, then 250M * 50 basic IF comparisons in a loop.
Since we are looking for latest items, depending on how the itemid is generated we might always be looking at items towards the end of the index and thus always scanning the full index and it won't matter what else we do - as long as the
WHERE '.dbConditionInt('itemid', $type_itemids).
is in there, which it is in all the posted patches, the problem won't be solved.
One thing that can help is reversing the index to (itemid DESC, clock) - this way, if I'm right, the index scan will always start close to the items we are looking for and the query will be quick. This might cause other problems though - like slowing down writing to the table.
Another thing would be to add an index by clock (since the currently existing (itemid, clock) index can not be used this way) and pre-select the rows that are older than what we are looking for and then filter by itemid within these. Something like
SELECT itemid
FROM (
SELECT itemid FROM history_X WHERE clock > N
)
WHERE itemid IN (.....)
GROUP BY itemid
|
|
Hi, vivanov. Thank you for your investigation and explanation. Unfortunately the provided solution did not add any performance gain on MySQL/PostgreSQL. At this point the ticket is going to be merged and closed soon, but the resolution of the issue will continue on larger scale by improving database structure.
|
|
Is there/ will there be another ZBX article, where the community can watch the ongoing development and discussion, regarding this bigger than expected problem averza?
|
|
Fixed in:
|
|
Here is a bit more thorough investigation, focusing on my second suggestion from above:
I recorded a latest-data query from my DB (PostgreSQL) that was running slowly:
Cost = 0.56 - 3'228'852.84
Compared to what I suggest:
Cost = 0.56 - 753'747.83
I added an index on the clock column:
And did the same queries and Postgre decided to ignore the new index, I tried with
but it didn't use either.
The VACUUM ANALYZE changed the predictions though, so here is what I get at the end:
Original query:
Suggested query:
Suggested, with grouping:
Suggested, with DISTINCT:
All the suggested variants have Cost = 0.56 - 33'897.42 (or 32'292.77)
The original - Cost = 1'000.58 - 202'475.31
This is a clear improvement both in complexity and cost and it doesn't involve creating a new index.
Although, to be honest, the greatest change in predicted cost came from simply vacuuming the table.
And finally the actual run times of the queries:
Suggested (with DISTINCT): 4127.091 ms (00:04.127)
Original: 8841.342 ms (00:08.841)
Both returning 189 rows.
After being cached by the DB:
Suggested (with DISTINCT): 150.435 ms
Original: 883.536 ms
Based on that I would recommend to use this variant of the query:
It seems to improve not by lowering the total row count, but by eliminating the overhead of aggregation, which is not what I intended and it doesn't improve as much as we would like, I guess, but halving the execution time is still a gain.
Indexing on history_X(clock, itemid) should also be tested more thoroughly, because the fact that it didn't get used in this case doesn't mean there wouldn't be a situation when it gets chosen by the query optimizer.
Also what @dimir suggests above is reasonable and I expect it to be the real improvement that I was looking for initially.
|
|
Hi, vivanov. Please note that the mentioned, original SQL (that one with HAVING clause), has already been fixed in the very first commit. Please also note that history tables are optimized for writes, therefore adding new indexes is not an option. All other options (not considering DB structure change) include playing with SQL syntax which did not actually show any good results under heavy circumstances.
|
|
@Andrejs Verza, That "playing with SQL syntax" is changing the structure of the query execution plan considerably.
There is a clear difference between
And
The run times improve a lot on my system, it is repeatable and it is especially noticeable when clock is a more recent value.
Please try again with this query:
You might have gotten bad results before, since the query in my first post wouldn't even return the correct rows - it returns 1000's where it should return a 100.
This does return the correct result and improves run time.
|
|
vivanov, in your last comment you're referring to decomposition of SQL plan, in which there is this fragment:
(max(clock) > 1597228657)
Are you sure you're operating with the up-to-date data, since according to this commit, there is no more aggregation by max clock?
|
|
No, I'm not on the latest patch.
Judging by the query plans the DB generates, the change in this commit should do pretty much the same thing as the query that I'm suggesting.
Alright, I'll check how it does after it gets released in 5.0.3 and if there is something to add I'll come back.
|
|
Hi, I have applied the new patch, but I didn't notice any improvement.
For the record, we have about 200 hosts with roughly 3K+ items each.
We are still experiencing the same timeouts due to the slow queries
on these "big hosts" and while trying to load the Latest Data page without filters.
|
|
patch_for_5.0.2_v2.2.patch for 5.0.2 from fix for 5.0.3rc1 2143dcc
We are considering another option - to make a change in data structure and application design to improve performance.
|
|
Hello, sorry but the latest patch is not working.
I cannot install it.
I don't even have "ui" folder in my installation,
root@zabbix:~# git apply 112275_patch_for_5.0.2_v2.2.patch
error: ui/app/controllers/CControllerLatest.php: Nie ma takiego pliku ani katalogu
error: ui/app/controllers/CControllerLatestView.php: Nie ma takiego pliku ani katalogu
error: ui/app/controllers/CControllerLatestViewRefresh.php: Nie ma takiego pliku ani katalogu
error: ui/include/classes/api/managers/CHistoryManager.php: Nie ma takiego pliku ani katalogu
When I try to find target files:
root@zabbix:/etc/zabbix# find / -name CControllerLatest.php
/usr/share/zabbix/app/controllers/CControllerLatest.php
Could you please provide steps how to install patch properly?
I am using Ubuntu 16 so "zabbix-frontend-php-deprecated" 5.0.2 package is used if it has any matter.
Or if anyone can assis how to rollback 5.0.2 to 5.0.1 in ubuntu that would be helpful.
apt-get install «pkg»=«version»
shows only 5.0.2 version, and cannot install 5.0.1 with apt.
I can rollback by restoring snapshot before 5.0.2 upgrade, but then losing collected data since then.
|
|
Hi, Kendzens. Please apply patch_for_5.0.2_v2.1_no_ui_folder.patch.
Put the file inside /usr/share/zabbix directory and then git apply patch_for_5.0.2_v2.1_no_ui_folder.patch.
|
|
@ Kendzens You can manually download and install the DEB file? For example:
https://repo.zabbix.com/zabbix/5.0/ubuntu/pool/main/z/zabbix/zabbix-frontend-php-deprecated_5.0.1-1%2Bxenial_all.deb
|
|
Guys who had performance issues, you are welcome to test changes in ZBX-18261 .
|
|
@https://support.zabbix.com/browse/ZBX-18071?focusedCommentId=455832&page=com.atlassian.jira.plugin.system.issuetabpanels:comment-tabpanel#comment-455832
Thank you Andrejs,
I have applied no ui patch and it not worked. Latest Data was still hung.
After Applying I have restarted zabbix-server service.
@https://support.zabbix.com/browse/ZBX-18071?focusedCommentId=455863&page=com.atlassian.jira.plugin.system.issuetabpanels:comment-tabpanel#comment-455863
Marco you are a lifesaver, I was looking for that deb direct link today with no luck. now you haelped me with this url.
I have downgraded to 5.0.1 and I'm again happy user. Everything works smooth.
|
|
Seems not fixed in 5.0.3 : 5-8s to have the page :
First host :
Total time: 7.366574
Total SQL time: 7.341007
SQL count: 76 (selects: 59 | executes: 27)
Peak memory usage: 4M
Memory limit: 1G
The second host (same templates, sames items) :
Total time: 0.130166
Total SQL time: 0.106521
SQL count: 73 (selects: 56 | executes: 27)
Peak memory usage: 4M
Memory limit: 1G
|
|
The problem not resolved in 5.0.3 for PostgreSQL:
Total time: 31.01048
Total SQL time: 30.930492
SQL count: 88 (selects: 79 | executes: 19)
Peak memory usage: 6M
Memory limit: 128M
Longest requests:
SQL (0.431231): SELECT itemid FROM history_str WHERE itemid IN (79175,79177,79196,79201) AND clock>1598958317 GROUP BY itemid
zabbix.php:21 → require_once() → ZBase->run() → ZBase->processRequest() → CController->run() → CControllerLatestView->doAction() → CControllerLatest->prepareData() → CHistoryManager->getItemsHavingValues() → CHistoryManager->getItemsHavingValuesFromSql() → DBselect() in include/classes/api/managers/CHistoryManager.php:78
Explain Analyze (re-execution is fast):
Group (cost=0.42..79.38 rows=78 width=8) (actual time=0.091..0.845 rows=4 loops=1)
Output: itemid
Group Key: history_str.itemid
-> Index Only Scan using history_str_1 on public.history_str (cost=0.42..79.18 rows=80 width=8) (actual time=0.088..0.812 rows=96 loops=1)
Output: itemid, clock
Index Cond: ((history_str.itemid = ANY ('{79175,79177,79196,79201}'::bigint[])) AND (history_str.clock > 1598958317))
Heap Fetches: 96
Planning time: 0.391 ms
Execution time: 0.880 ms
SQL (26.423314): SELECT itemid FROM history_uint WHERE itemid IN (79176,79178,79179,79180,79181,79182,79183,79187,79197,79198,79200,79202,79203,79204,79205,79207,79418,79419,79424,79425,79426,79427,79432,79433,79434,79435,79436,79437,79438,79439) AND clock>1598958317 GROUP BY itemid
zabbix.php:21 → require_once() → ZBase->run() → ZBase->processRequest() → CController->run() → CControllerLatestView->doAction() → CControllerLatest->prepareData() → CHistoryManager->getItemsHavingValues() → CHistoryManager->getItemsHavingValuesFromSql() → DBselect() in include/classes/api/managers/CHistoryManager.php:78
Explain Analyze (re-execution is fast):
Group (cost=0.57..61.77 rows=127 width=8) (actual time=0.079..90.334 rows=30 loops=1)
Output: itemid
Group Key: history_uint.itemid
-> Index Only Scan using history_uint_1 on public.history_uint (cost=0.57..61.45 rows=128 width=8) (actual time=0.077..86.178 rows=27090 loops=1)
Output: itemid, clock
Index Cond: ((history_uint.itemid = ANY ('{79176,79178,79179,79180,79181,79182,79183,79187,79197,79198,79200,79202,79203,79204,79205,79207,79418,79419,79424,79425,79426,79427,79432,79433,79434,79435,79436,79437,79438,79439}'::bigint[])) AND (history_uint.clock > 1598958317))
Heap Fetches: 12542
Planning time: 0.292 ms
Execution time: 90.368 ms
SQL (3.98664): SELECT itemid FROM history WHERE itemid IN (79184,79185,79186,79188,79189,79190,79191,79192,79193,79194,79195,79199,79206,79420,79421,79422,79423,79428,79429,79430,79431) AND clock>1598958317 GROUP BY itemid
zabbix.php:21 → require_once() → ZBase->run() → ZBase->processRequest() → CController->run() → CControllerLatestView->doAction() → CControllerLatest->prepareData() → CHistoryManager->getItemsHavingValues() → CHistoryManager->getItemsHavingValuesFromSql() → DBselect() in include/classes/api/managers/CHistoryManager.php:78
Explain Analyze (re-execution is fast):
Group (cost=0.57..15188.91 rows=5735 width=8) (actual time=0.081..165.820 rows=21 loops=1)
Output: itemid
Group Key: history.itemid
-> Index Only Scan using history_1 on public.history (cost=0.57..15154.97 rows=13574 width=8) (actual time=0.079..158.836 rows=30471 loops=1)
Output: itemid, clock
Index Cond: ((history.itemid = ANY ('{79184,79185,79186,79188,79189,79190,79191,79192,79193,79194,79195,79199,79206,79420,79421,79422,79423,79428,79429,79430,79431}'::bigint[])) AND (history.clock > 1598958317))
Heap Fetches: 30471
Planning time: 0.308 ms
Execution time: 165.874 ms
Another example:
Number of rows in the table 263988147, index Btree.
explain (analyze, buffers, verbose) SELECT itemid FROM history_uint WHERE itemid IN (25751,25752,25753,25754,25755,25781,25812,25818,25819,25814,25857,25828,26916,26942,26923,26985,26936,43720,43751,58487,58613,61182,61224,61263,61305,61344,61329,61487,61445,61593,61541,61578,82099,91695) AND clock>1598956104 GROUP BY itemid
Group (cost=0.57..71.68 rows=167 width=8) (actual time=7.335..35982.303 rows=16 loops=1)
Output: itemid
Group Key: history_uint.itemid
Buffers: shared hit=4997 read=7425 dirtied=10131
-> Index Only Scan using history_uint_1 on public.history_uint (cost=0.57..71.25 rows=169 width=8) (actual time=7.331..35971.802 rows=24712 loops=1)
Output: itemid, clock
Index Cond: ((history_uint.itemid = ANY ('{25751,25752,25753,25754,25755,25781,25812,25818,25819,25814,25857,25828,26916,26942,26923,26985,26936,43720,43751,58487,58613,61182,61224,61263,61305,61344,61329,61487,61445,61593,61541,61578,82099,91695}'::bigint[])) AND (history_uint.clock > 1598956104))
Heap Fetches: 11774
Buffers: shared hit=4997 read=7425 dirtied=10131
Planning time: 0.280 ms
Execution time: 35982.340 ms
Probably cause: slow WHERE ... IN (...)
https://stackoverflow.com/questions/24647503/performance-issue-in-update-query
https://stackoverflow.com/questions/17813492/postgres-not-in-performance
|
|
Good Morning
I have the same problem with the version 5.0.3
Total time: 0.079225
Total SQL time: 0.057637
SQL count: 48 (selects: 45 | executes: 12)
Peak memory usage: 6M
Memory limit: 128M
1.
host.get
[CControllerHost.php:93]
Parameters:
Array ( [output] => Array ( [0] => hostid [1] => name [2] => status ) [evaltype] => 0 [tags] => Array ( ) [inheritedTags] => 1 [groupids] => [severities] => [withProblemsSuppressed] => [search] => Array ( [name] => mtflosrv004 [ip] => [dns] => ) [filter] => Array ( [status] => [port] => [maintenance_status] => ) [sortfield] => name [limit] => 10001 [preservekeys] => 1 ) |
Result:
Array ( [11205] => Array ( [hostid] => 11205 [name] => MTFLOSRV004 [status] => 0 ) ) |
2.
host.get
[CControllerHost.php:129]
Parameters:
Array ( [output] => Array ( [0] => hostid [1] => name [2] => status [3] => maintenance_status [4] => maintenanceid [5] => maintenance_type [6] => available [7] => snmp_available [8] => jmx_available [9] => ipmi_available [10] => error [11] => ipmi_error [12] => snmp_error [13] => jmx_error ) [selectInterfaces] => Array ( [0] => ip [1] => dns [2] => port [3] => main [4] => type [5] => useip ) [selectGraphs] => count [selectScreens] => count [selectHttpTests] => count [selectTags] => Array ( [0] => tag [1] => value ) [selectInheritedTags] => Array ( [0] => tag [1] => value ) [hostids] => Array ( [0] => 11205 ) [preservekeys] => 1 ) |
Result:
Array ( [11205] => Array ( [hostid] => 11205 [name] => MTFLOSRV004 [status] => 0 [maintenance_status] => 0 [maintenanceid] => 0 [maintenance_type] => 0 [available] => 1 [snmp_available] => 0 [jmx_available] => 0 [ipmi_available] => 0 [error] => [ipmi_error] => [snmp_error] => [jmx_error] => [graphs] => 33 [httpTests] => 0 [tags] => Array ( ) [interfaces] => Array ( [0] => Array ( [ip] => 172.16.25.4 [dns] => [port] => 10050 [main] => 1 [type] => 1 [useip] => 1 ) ) [screens] => 1 [inheritedTags] => Array ( ) ) ) |
3.
trigger.get
[CControllerHost.php:149]
Parameters:
Array ( [output] => Array ( ) [selectHosts] => Array ( [0] => hostid ) [hostids] => Array ( [0] => 11205 ) [skipDependent] => 1 [monitored] => 1 [preservekeys] => 1 ) |
Result:
Array ( [76261] => Array ( [triggerid] => 76261 [hosts] => Array ( [0] => Array ( [hostid] => 11205 ) ) ) [76262] => Array ( [triggerid] => 76262 [hosts] => Array ( [0] => Array ( [hostid] => 11205 ) ) ) [76263] => Array ( [triggerid] => 76263 [hosts] => Array ( [0] => Array ( [hostid] => 11205 ) ) ) [76264] => Array ( [triggerid] => 76264 [hosts] => Array ( [0] => Array ( [hostid] => 11205 ) ) ) [76265] => Array ( [triggerid] => 76265 [hosts] => Array ( [0] => Array ( [hostid] => 11205 ) ) ) [76266] => Array ( [triggerid] => 76266 [hosts] => Array ( [0] => Array ( [hostid] => 11205 ) ) ) [76267] => Array ( [triggerid] => 76267 [hosts] => Array ( [0] => Array ( [hostid] => 11205 ) ) ) [76268] => Array ( [triggerid] => 76268 [hosts] => Array ( [0] => Array ( [hostid] => 11205 ) ) ) [38577] => Array ( [triggerid] => 38577 [hosts] => Array ( [0] => Array ( [hostid] => 11205 ) ) ) [76270] => Array ( [triggerid] => 76270 [hosts] => Array ( [0] => Array ( [hostid] => 11205 ) ) ) [76271] => Array ( [triggerid] => 76271 [hosts] => Array ( [0] => Array ( [hostid] => 11205 ) ) ) [76272] => Array ( [triggerid] => 76272 [hosts] => Array ( [0] => Array ( [hostid] => 11205 ) ) ) [76273] => Array ( [triggerid] => 76273 [hosts] => Array ( [0] => Array ( [hostid] => 11205 ) ) ) [76274] => Array ( [triggerid] => 76274 [hosts] => Array ( [0] => Array ( [hostid] => 11205 ) ) ) [76279] => Array ( [triggerid] => 76279 [hosts] => Array ( [0] => Array ( [hostid] => 11205 ) ) ) [76283] => Array ( [triggerid] => 76283 [hosts] => Array ( [0] => Array ( [hostid] => 11205 ) ) ) [76287] => Array ( [triggerid] => 76287 [hosts] => Array ( [0] => Array ( [hostid] => 11205 ) ) ) [76280] => Array ( [triggerid] => 76280 [hosts] => Array ( [0] => Array ( [hostid] => 11205 ) ) ) [76284] => Array ( [triggerid] => 76284 [hosts] => Array ( [0] => Array ( [hostid] => 11205 ) ) ) [76288] => Array ( [triggerid] => 76288 [hosts] => Array ( [0] => Array ( [hostid] => 11205 ) ) ) [76281] => Array ( [triggerid] => 76281 [hosts] => Array ( [0] => Array ( [hostid] => 11205 ) ) ) [76285] => Array ( [triggerid] => 76285 [hosts] => Array ( [0] => Array ( [hostid] => 11205 ) ) ) [76289] => Array ( [triggerid] => 76289 [hosts] => Array ( [0] => Array ( [hostid] => 11205 ) ) ) [76282] => Array ( [triggerid] => 76282 [hosts] => Array ( [0] => Array ( [hostid] => 11205 ) ) ) [76286] => Array ( [triggerid] => 76286 [hosts] => Array ( [0] => Array ( [hostid] => 11205 ) ) ) [76290] => Array ( [triggerid] => 76290 [hosts] => Array ( [0] => Array ( [hostid] => 11205 ) ) ) [76275] => Array ( [triggerid] => 76275 [hosts] => Array ( [0] => Array ( [hostid] => 11205 ) ) ) ) |
4.
problem.get
[CControllerHost.php:158]
Parameters:
Array ( [output] => Array ( [0] => eventid [1] => objectid [2] => severity ) [objectids] => Array ( [0] => 76261 [1] => 76262 [2] => 76263 [3] => 76264 [4] => 76265 [5] => 76266 [6] => 76267 [7] => 76268 [8] => 38577 [9] => 76270 [10] => 76271 [11] => 76272 [12] => 76273 [13] => 76274 [14] => 76279 [15] => 76283 [16] => 76287 [17] => 76280 [18] => 76284 [19] => 76288 [20] => 76281 [21] => 76285 [22] => 76289 [23] => 76282 [24] => 76286 [25] => 76290 [26] => 76275 ) [source] => 0 [object] => 0 [suppressed] => ) |
Result:
Array ( [0] => Array ( [eventid] => 54710827 [objectid] => 76279 [severity] => 1 ) ) |
SQL (0.031619):
COMMIT
zabbix.php:21 → require_once() → ZBase->run() → ZBase->authenticateUser() → CWebUser::checkAuthentication() → CApiWrapper->__call() → CFrontendApiWrapper->callMethod() → CApiWrapper->callMethod() → CFrontendApiWrapper->callClientMethod() → CLocalApiClient->callMethod() → DBend() → DBcommit() → DBexecute() in include/db.inc.php:179
SQL (0.000306): SELECT md.moduleid,md.id,md.relative_path,md.config FROM module md WHERE md.status=1 ORDER BY md.relative_path
zabbix.php:21 → require_once() → ZBase->run() → ZBase->initModuleManager() → CModule->get() → DBselect() in include/classes/api/services/CModule.php:104
SQL (0.000221): SELECT NULL FROM users u WHERE u.userid=64 FOR UPDATE
zabbix.php:21 → require_once() → ZBase->run() → CViewHelper::loadSidebarMode() → CProfile::get() → CProfile::init() → DBselect() in include/classes/user/CProfile.php:38
SQL (0.000173): SELECT type,value_id,value_int,value_str,idx2 FROM profiles WHERE userid=64 AND idx='web.sidebar.mode'
zabbix.php:21 → require_once() → ZBase->run() → CViewHelper::loadSidebarMode() → CProfile::get() → DBselect() in include/classes/user/CProfile.php:180
SQL (0.000688): SELECT type,value_id,value_int,value_str,idx2 FROM profiles WHERE userid=64 AND idx='web.hostsmon.sort'
zabbix.php:21 → require_once() → ZBase->run() → ZBase->processRequest() → CController->run() → CControllerHostView->doAction() → CProfile::get() → DBselect() in include/classes/user/CProfile.php:180
SQL (0.000174): SELECT type,value_id,value_int,value_str,idx2 FROM profiles WHERE userid=64 AND idx='web.hostsmon.sortorder'
zabbix.php:21 → require_once() → ZBase->run() → ZBase->processRequest() → CController->run() → CControllerHostView->doAction() → CProfile::get() → DBselect() in include/classes/user/CProfile.php:180
SQL (0.000157): SELECT type,value_id,value_int,value_str,idx2 FROM profiles WHERE userid=64 AND idx='web.hostsmon.filter.active'
zabbix.php:21 → require_once() → ZBase->run() → ZBase->processRequest() → CController->run() → CControllerHostView->doAction() → CProfile::get() → DBselect() in include/classes/user/CProfile.php:180
SQL (0.000123): SELECT type,value_id,value_int,value_str,idx2 FROM profiles WHERE userid=64 AND idx='web.hostsmon.filter.tags.tag'
zabbix.php:21 → require_once() → ZBase->run() → ZBase->processRequest() → CController->run() → CControllerHostView->doAction() → CProfile::getArray() → CProfile::get() → DBselect() in include/classes/user/CProfile.php:180
SQL (0.000165): SELECT type,value_id,value_int,value_str,idx2 FROM profiles WHERE userid=64 AND idx='web.hostsmon.filter.name'
zabbix.php:21 → require_once() → ZBase->run() → ZBase->processRequest() → CController->run() → CControllerHostView->doAction() → CProfile::get() → DBselect() in include/classes/user/CProfile.php:180
SQL (0.000141): SELECT type,value_id,value_int,value_str,idx2 FROM profiles WHERE userid=64 AND idx='web.hostsmon.filter.groupids'
zabbix.php:21 → require_once() → ZBase->run() → ZBase->processRequest() → CController->run() → CControllerHostView->doAction() → CProfile::getArray() → CProfile::get() → DBselect() in include/classes/user/CProfile.php:180
SQL (0.000139): SELECT type,value_id,value_int,value_str,idx2 FROM profiles WHERE userid=64 AND idx='web.hostsmon.filter.ip'
zabbix.php:21 → require_once() → ZBase->run() → ZBase->processRequest() → CController->run() → CControllerHostView->doAction() → CProfile::get() → DBselect() in include/classes/user/CProfile.php:180
SQL (0.000126): SELECT type,value_id,value_int,value_str,idx2 FROM profiles WHERE userid=64 AND idx='web.hostsmon.filter.dns'
zabbix.php:21 → require_once() → ZBase->run() → ZBase->processRequest() → CController->run() → CControllerHostView->doAction() → CProfile::get() → DBselect() in include/classes/user/CProfile.php:180
SQL (0.000116): SELECT type,value_id,value_int,value_str,idx2 FROM profiles WHERE userid=64 AND idx='web.hostsmon.filter.port'
zabbix.php:21 → require_once() → ZBase->run() → ZBase->processRequest() → CController->run() → CControllerHostView->doAction() → CProfile::get() → DBselect() in include/classes/user/CProfile.php:180
SQL (0.000142): SELECT type,value_id,value_int,value_str,idx2 FROM profiles WHERE userid=64 AND idx='web.hostsmon.filter.status'
zabbix.php:21 → require_once() → ZBase->run() → ZBase->processRequest() → CController->run() → CControllerHostView->doAction() → CProfile::get() → DBselect() in include/classes/user/CProfile.php:180
SQL (0.000143): SELECT type,value_id,value_int,value_str,idx2 FROM profiles WHERE userid=64 AND idx='web.hostsmon.filter.evaltype'
zabbix.php:21 → require_once() → ZBase->run() → ZBase->processRequest() → CController->run() → CControllerHostView->doAction() → CProfile::get() → DBselect() in include/classes/user/CProfile.php:180
SQL (0.00014): SELECT type,value_id,value_int,value_str,idx2 FROM profiles WHERE userid=64 AND idx='web.hostsmon.filter.severities'
zabbix.php:21 → require_once() → ZBase->run() → ZBase->processRequest() → CController->run() → CControllerHostView->doAction() → CProfile::getArray() → CProfile::get() → DBselect() in include/classes/user/CProfile.php:180
SQL (0.000147): SELECT type,value_id,value_int,value_str,idx2 FROM profiles WHERE userid=64 AND idx='web.hostsmon.filter.show_suppressed'
zabbix.php:21 → require_once() → ZBase->run() → ZBase->processRequest() → CController->run() → CControllerHostView->doAction() → CProfile::get() → DBselect() in include/classes/user/CProfile.php:180
SQL (0.000154): SELECT type,value_id,value_int,value_str,idx2 FROM profiles WHERE userid=64 AND idx='web.hostsmon.filter.maintenance_status'
zabbix.php:21 → require_once() → ZBase->run() → ZBase->processRequest() → CController->run() → CControllerHostView->doAction() → CProfile::get() → DBselect() in include/classes/user/CProfile.php:180
SQL (0.00026): SELECT c.* FROM config c
zabbix.php:21 → require_once() → ZBase->run() → ZBase->processRequest() → CController->run() → CControllerHostView->doAction() → CControllerHost->prepareData() → select_config() → DBselect() in include/profiles.inc.php:33
SQL (6.7E-5): BEGIN
zabbix.php:21 → require_once() → ZBase->run() → ZBase->processRequest() → CController->run() → CControllerHostView->doAction() → CControllerHost->prepareData() → CApiWrapper->__call() → CFrontendApiWrapper->callMethod() → CApiWrapper->callMethod() → CFrontendApiWrapper->callClientMethod() → CLocalApiClient->callMethod() → DBstart() → DBexecute() in include/db.inc.php:125
SQL (0.001038): SELECT h.hostid,h.name,h.status FROM hosts h WHERE h.flags IN (0,4) AND h.status IN (0,1) AND ((UPPER(h.name) LIKE '%MTFLOSRV004%' ESCAPE '!')) ORDER BY h.name LIMIT 10001
zabbix.php:21 → require_once() → ZBase->run() → ZBase->processRequest() → CController->run() → CControllerHostView->doAction() → CControllerHost->prepareData() → CApiWrapper->__call() → CFrontendApiWrapper->callMethod() → CApiWrapper->callMethod() → CFrontendApiWrapper->callClientMethod() → CLocalApiClient->callMethod() → CHost->get() → CApiService->customFetch() → DBselect() in include/classes/api/CApiService.php:1098
SQL (5.3E-5): COMMIT
zabbix.php:21 → require_once() → ZBase->run() → ZBase->processRequest() → CController->run() → CControllerHostView->doAction() → CControllerHost->prepareData() → CApiWrapper->__call() → CFrontendApiWrapper->callMethod() → CApiWrapper->callMethod() → CFrontendApiWrapper->callClientMethod() → CLocalApiClient->callMethod() → DBend() → DBcommit() → DBexecute() in include/db.inc.php:179
SQL (5.2E-5): BEGIN
zabbix.php:21 → require_once() → ZBase->run() → ZBase->processRequest() → CController->run() → CControllerHostView->doAction() → CControllerHost->prepareData() → CApiWrapper->__call() → CFrontendApiWrapper->callMethod() → CApiWrapper->callMethod() → CFrontendApiWrapper->callClientMethod() → CLocalApiClient->callMethod() → DBstart() → DBexecute() in include/db.inc.php:125
SQL (0.000197): SELECT h.hostid,h.name,h.status,h.maintenance_status,h.maintenanceid,h.maintenance_type,h.available,h.snmp_available,h.jmx_available,h.ipmi_available,h.error,h.ipmi_error,h.snmp_error,h.jmx_error FROM hosts h WHERE h.flags IN (0,4) AND h.hostid=11205 AND h.status IN (0,1)
zabbix.php:21 → require_once() → ZBase->run() → ZBase->processRequest() → CController->run() → CControllerHostView->doAction() → CControllerHost->prepareData() → CApiWrapper->__call() → CFrontendApiWrapper->callMethod() → CApiWrapper->callMethod() → CFrontendApiWrapper->callClientMethod() → CLocalApiClient->callMethod() → CHost->get() → CApiService->customFetch() → DBselect() in include/classes/api/CApiService.php:1098
SQL (0.006594): SELECT DISTINCT COUNT(DISTINCT g.graphid) AS rowscount,i.hostid FROM graphs g,graphs_items gi,items i WHERE i.hostid=11205 AND gi.graphid=g.graphid AND i.itemid=gi.itemid AND g.flags IN (0,4) GROUP BY i.hostid
zabbix.php:21 → require_once() → ZBase->run() → ZBase->processRequest() → CController->run() → CControllerHostView->doAction() → CControllerHost->prepareData() → CApiWrapper->__call() → CFrontendApiWrapper->callMethod() → CApiWrapper->callMethod() → CFrontendApiWrapper->callClientMethod() → CLocalApiClient->callMethod() → CHost->get() → CHost->addRelatedObjects() → CHostGeneral->addRelatedObjects() → CGraph->get() → DBselect() in include/classes/api/services/CGraph.php:290
SQL (0.004319): SELECT COUNT(DISTINCT ht.httptestid) AS rowscount,ht.hostid FROM httptest ht WHERE ht.hostid=11205 GROUP BY ht.hostid
zabbix.php:21 → require_once() → ZBase->run() → ZBase->processRequest() → CController->run() → CControllerHostView->doAction() → CControllerHost->prepareData() → CApiWrapper->__call() → CFrontendApiWrapper->callMethod() → CApiWrapper->callMethod() → CFrontendApiWrapper->callClientMethod() → CLocalApiClient->callMethod() → CHost->get() → CHost->addRelatedObjects() → CHostGeneral->addRelatedObjects() → CHttpTest->get() → DBselect() in include/classes/api/services/CHttpTest.php:202
SQL (0.001484): SELECT hosttagid,tag,value,hostid FROM host_tag WHERE hostid=11205
zabbix.php:21 → require_once() → ZBase->run() → ZBase->processRequest() → CController->run() → CControllerHostView->doAction() → CControllerHost->prepareData() → CApiWrapper->__call() → CFrontendApiWrapper->callMethod() → CApiWrapper->callMethod() → CFrontendApiWrapper->callClientMethod() → CLocalApiClient->callMethod() → CHost->get() → CHost->addRelatedObjects() → CHostGeneral->addRelatedObjects() → DBselect() in include/classes/api/services/CHostGeneral.php:957
SQL (0.000281): SELECT hi.interfaceid,hi.ip,hi.dns,hi.port,hi.main,hi.type,hi.useip,hi.hostid FROM interface hi WHERE hi.hostid=11205
zabbix.php:21 → require_once() → ZBase->run() → ZBase->processRequest() → CController->run() → CControllerHostView->doAction() → CControllerHost->prepareData() → CApiWrapper->__call() → CFrontendApiWrapper->callMethod() → CApiWrapper->callMethod() → CFrontendApiWrapper->callClientMethod() → CLocalApiClient->callMethod() → CHost->get() → CHost->addRelatedObjects() → CHostInterface->get() → DBselect() in include/classes/api/services/CHostInterface.php:164
SQL (0.000271): SELECT ht.* FROM hosts_templates ht WHERE hostid=11205
zabbix.php:21 → require_once() → ZBase->run() → ZBase->processRequest() → CController->run() → CControllerHostView->doAction() → CControllerHost->prepareData() → CApiWrapper->__call() → CFrontendApiWrapper->callMethod() → CApiWrapper->callMethod() → CFrontendApiWrapper->callClientMethod() → CLocalApiClient->callMethod() → CHost->get() → CHost->addRelatedObjects() → CTemplateScreen->get() → DBselect() in include/classes/api/services/CTemplateScreen.php:170
SQL (0.000109): SELECT ht.* FROM hosts_templates ht WHERE hostid=10109
zabbix.php:21 → require_once() → ZBase->run() → ZBase->processRequest() → CController->run() → CControllerHostView->doAction() → CControllerHost->prepareData() → CApiWrapper->__call() → CFrontendApiWrapper->callMethod() → CApiWrapper->callMethod() → CFrontendApiWrapper->callClientMethod() → CLocalApiClient->callMethod() → CHost->get() → CHost->addRelatedObjects() → CTemplateScreen->get() → DBselect() in include/classes/api/services/CTemplateScreen.php:170
SQL (0.00316): SELECT COUNT(DISTINCT s.screenid) AS rowscount,s.templateid FROM screens s WHERE s.templateid IS NOT NULL AND s.templateid IN (10109,11205) GROUP BY s.templateid
zabbix.php:21 → require_once() → ZBase->run() → ZBase->processRequest() → CController->run() → CControllerHostView->doAction() → CControllerHost->prepareData() → CApiWrapper->__call() → CFrontendApiWrapper->callMethod() → CApiWrapper->callMethod() → CFrontendApiWrapper->callClientMethod() → CLocalApiClient->callMethod() → CHost->get() → CHost->addRelatedObjects() → CTemplateScreen->get() → DBselect() in include/classes/api/services/CTemplateScreen.php:203
SQL (0.000209): SELECT ht.hostid,ht.templateid FROM hosts_templates ht WHERE ht.hostid=11205
zabbix.php:21 → require_once() → ZBase->run() → ZBase->processRequest() → CController->run() → CControllerHostView->doAction() → CControllerHost->prepareData() → CApiWrapper->__call() → CFrontendApiWrapper->callMethod() → CApiWrapper->callMethod() → CFrontendApiWrapper->callClientMethod() → CLocalApiClient->callMethod() → CHost->get() → CHost->addRelatedObjects() → CApiHostHelper::getParentTemplates() → DBselect() in include/classes/api/helpers/CApiHostHelper.php:51
SQL (0.000146): SELECT ht.hostid,ht.templateid FROM hosts_templates ht WHERE ht.hostid=10109
zabbix.php:21 → require_once() → ZBase->run() → ZBase->processRequest() → CController->run() → CControllerHostView->doAction() → CControllerHost->prepareData() → CApiWrapper->__call() → CFrontendApiWrapper->callMethod() → CApiWrapper->callMethod() → CFrontendApiWrapper->callClientMethod() → CLocalApiClient->callMethod() → CHost->get() → CHost->addRelatedObjects() → CApiHostHelper::getParentTemplates() → DBselect() in include/classes/api/helpers/CApiHostHelper.php:51
SQL (0.000201): SELECT h.hostid FROM hosts h WHERE h.status=3 AND h.hostid=10109
zabbix.php:21 → require_once() → ZBase->run() → ZBase->processRequest() → CController->run() → CControllerHostView->doAction() → CControllerHost->prepareData() → CApiWrapper->__call() → CFrontendApiWrapper->callMethod() → CApiWrapper->callMethod() → CFrontendApiWrapper->callClientMethod() → CLocalApiClient->callMethod() → CHost->get() → CHost->addRelatedObjects() → CTemplate->get() → DBselect() in include/classes/api/services/CTemplate.php:266
SQL (0.000124): SELECT hosttagid,tag,value,hostid FROM host_tag WHERE hostid=10109
zabbix.php:21 → require_once() → ZBase->run() → ZBase->processRequest() → CController->run() → CControllerHostView->doAction() → CControllerHost->prepareData() → CApiWrapper->__call() → CFrontendApiWrapper->callMethod() → CApiWrapper->callMethod() → CFrontendApiWrapper->callClientMethod() → CLocalApiClient->callMethod() → CHost->get() → CHost->addRelatedObjects() → CTemplate->get() → CTemplate->addRelatedObjects() → CHostGeneral->addRelatedObjects() → DBselect() in include/classes/api/services/CHostGeneral.php:957
SQL (5.0E-5): COMMIT
zabbix.php:21 → require_once() → ZBase->run() → ZBase->processRequest() → CController->run() → CControllerHostView->doAction() → CControllerHost->prepareData() → CApiWrapper->__call() → CFrontendApiWrapper->callMethod() → CApiWrapper->callMethod() → CFrontendApiWrapper->callClientMethod() → CLocalApiClient->callMethod() → DBend() → DBcommit() → DBexecute() in include/db.inc.php:179
SQL (0.00011): BEGIN
zabbix.php:21 → require_once() → ZBase->run() → ZBase->processRequest() → CController->run() → CControllerHostView->doAction() → CControllerHost->prepareData() → CApiWrapper->__call() → CFrontendApiWrapper->callMethod() → CApiWrapper->callMethod() → CFrontendApiWrapper->callClientMethod() → CLocalApiClient->callMethod() → DBstart() → DBexecute() in include/db.inc.php:125
SQL (0.001352): SELECT DISTINCT t.triggerid FROM triggers t,functions f,items i WHERE i.hostid=11205 AND f.triggerid=t.triggerid AND f.itemid=i.itemid AND NOT EXISTS (SELECT NULL FROM functions f,items i,hosts h WHERE t.triggerid=f.triggerid AND f.itemid=i.itemid AND i.hostid=h.hostid AND (i.status<>0 OR h.status<>0)) AND t.status=0 AND t.flags IN (0,4)
zabbix.php:21 → require_once() → ZBase->run() → ZBase->processRequest() → CController->run() → CControllerHostView->doAction() → CControllerHost->prepareData() → CApiWrapper->__call() → CFrontendApiWrapper->callMethod() → CApiWrapper->callMethod() → CFrontendApiWrapper->callClientMethod() → CLocalApiClient->callMethod() → CTrigger->get() → CApiService->customFetch() → DBselect() in include/classes/api/CApiService.php:1066
SQL (0.000343): SELECT d.triggerid_down,d.triggerid_up,t.value FROM trigger_depends d,triggers t WHERE d.triggerid_up=t.triggerid AND d.triggerid_down IN (38577,76261,76262,76263,76264,76265,76266,76267,76268,76270,76271,76272,76273,76274,76275,76279,76280,76281,76282,76283,76284,76285,76286,76287,76288,76289,76290)
zabbix.php:21 → require_once() → ZBase->run() → ZBase->processRequest() → CController->run() → CControllerHostView->doAction() → CControllerHost->prepareData() → CApiWrapper->__call() → CFrontendApiWrapper->callMethod() → CApiWrapper->callMethod() → CFrontendApiWrapper->callClientMethod() → CLocalApiClient->callMethod() → CTrigger->get() → CApiService->customFetch() → CTrigger->applyPostSqlFiltering() → DBselect() in include/classes/api/services/CTrigger.php:1365
SQL (0.000117): SELECT t.triggerid FROM triggers t,functions f,items i,hosts h WHERE t.triggerid=f.triggerid AND f.itemid=i.itemid AND i.hostid=h.hostid AND (i.status=1 OR h.status=1 OR t.status=1) AND 1=0
zabbix.php:21 → require_once() → ZBase->run() → ZBase->processRequest() → CController->run() → CControllerHostView->doAction() → CControllerHost->prepareData() → CApiWrapper->__call() → CFrontendApiWrapper->callMethod() → CApiWrapper->callMethod() → CFrontendApiWrapper->callClientMethod() → CLocalApiClient->callMethod() → CTrigger->get() → CApiService->customFetch() → CTrigger->applyPostSqlFiltering() → DBselect() in include/classes/api/services/CTrigger.php:1406
SQL (0.000424): SELECT f.triggerid,i.hostid FROM functions f,items i WHERE f.triggerid IN (38577,76261,76262,76263,76264,76265,76266,76267,76268,76270,76271,76272,76273,76274,76275,76279,76280,76281,76282,76283,76284,76285,76286,76287,76288,76289,76290) AND f.itemid=i.itemid
zabbix.php:21 → require_once() → ZBase->run() → ZBase->processRequest() → CController->run() → CControllerHostView->doAction() → CControllerHost->prepareData() → CApiWrapper->__call() → CFrontendApiWrapper->callMethod() → CApiWrapper->callMethod() → CFrontendApiWrapper->callClientMethod() → CLocalApiClient->callMethod() → CTrigger->get() → CTrigger->addRelatedObjects() → CTriggerGeneral->addRelatedObjects() → DBselect() in include/classes/api/services/CTriggerGeneral.php:697
SQL (0.000179): SELECT h.hostid FROM hosts h WHERE h.flags IN (0,4) AND h.hostid=11205 AND h.status IN (0,1,3)
zabbix.php:21 → require_once() → ZBase->run() → ZBase->processRequest() → CController->run() → CControllerHostView->doAction() → CControllerHost->prepareData() → CApiWrapper->__call() → CFrontendApiWrapper->callMethod() → CApiWrapper->callMethod() → CFrontendApiWrapper->callClientMethod() → CLocalApiClient->callMethod() → CTrigger->get() → CTrigger->addRelatedObjects() → CTriggerGeneral->addRelatedObjects() → CHost->get() → CApiService->customFetch() → DBselect() in include/classes/api/CApiService.php:1098
SQL (6.0E-5): COMMIT
zabbix.php:21 → require_once() → ZBase->run() → ZBase->processRequest() → CController->run() → CControllerHostView->doAction() → CControllerHost->prepareData() → CApiWrapper->__call() → CFrontendApiWrapper->callMethod() → CApiWrapper->callMethod() → CFrontendApiWrapper->callClientMethod() → CLocalApiClient->callMethod() → DBend() → DBcommit() → DBexecute() in include/db.inc.php:179
SQL (5.4E-5): BEGIN
zabbix.php:21 → require_once() → ZBase->run() → ZBase->processRequest() → CController->run() → CControllerHostView->doAction() → CControllerHost->prepareData() → CApiWrapper->__call() → CFrontendApiWrapper->callMethod() → CApiWrapper->callMethod() → CFrontendApiWrapper->callClientMethod() → CLocalApiClient->callMethod() → DBstart() → DBexecute() in include/db.inc.php:125
SQL (0.000647): SELECT p.eventid,p.objectid,p.severity FROM problem p WHERE p.source='0' AND p.object='0' AND p.objectid IN (38577,76261,76262,76263,76264,76265,76266,76267,76268,76270,76271,76272,76273,76274,76275,76279,76280,76281,76282,76283,76284,76285,76286,76287,76288,76289,76290) AND NOT EXISTS (SELECT NULL FROM event_suppress es WHERE es.eventid=p.eventid) AND p.r_eventid IS NULL
zabbix.php:21 → require_once() → ZBase->run() → ZBase->processRequest() → CController->run() → CControllerHostView->doAction() → CControllerHost->prepareData() → CApiWrapper->__call() → CFrontendApiWrapper->callMethod() → CApiWrapper->callMethod() → CFrontendApiWrapper->callClientMethod() → CLocalApiClient->callMethod() → CProblem->get() → DBselect() in include/classes/api/services/CProblem.php:336
SQL (4.9E-5): COMMIT
zabbix.php:21 → require_once() → ZBase->run() → ZBase->processRequest() → CController->run() → CControllerHostView->doAction() → CControllerHost->prepareData() → CApiWrapper->__call() → CFrontendApiWrapper->callMethod() → CApiWrapper->callMethod() → CFrontendApiWrapper->callClientMethod() → CLocalApiClient->callMethod() → DBend() → DBcommit() → DBexecute() in include/db.inc.php:179
SQL (0.000326): SELECT type,value_id,value_int,value_str,idx2 FROM profiles WHERE userid=64 AND idx='web.layout.mode'
zabbix.php:21 → require_once() → ZBase->run() → ZBase->processRequest() → ZBase->processResponseFinal() → CView->getOutput() → include() → CView->getLayoutMode() → CViewHelper::loadLayoutMode() → CProfile::get() → DBselect() in include/classes/user/CProfile.php:180
SQL (0.000487): SELECT type,value_id,value_int,value_str,idx2 FROM profiles WHERE userid=64 AND idx='web.login.attempt.failed'
zabbix.php:21 → require_once() → ZBase->run() → ZBase->processRequest() → ZBase->processResponseFinal() → CView->getOutput() → include() → CWidget->show() → CWidget->toString() → get_prepared_messages() → CProfile::get() → DBselect() in include/classes/user/CProfile.php:180
|
|
Hi, Seraph! Let me remind you and other users that further development was moved to ZBX-18261. Please make sure you're up to date.
|
|
Hi everyone,
I've noticed another problem related to this query.
If you look for an host on the search bar or via Monitoring->Hosts, by clicking the button "Latest data" on the host row,
it does redirects you to the Latest data page, but it seems to ignore the workaround that forces you to show items without data by default.
The box becomes automatically unchecked, while reaching the same page through Monitoring->Latest data works as expected (so it stays checked until you uncheck it).
|
|
Hi @Stefano,
Yes, it is by default unchecked. When you manually check it, it retains the state of the filter while you go back and forth between pages, but when you go there via a "Latest data" link on a host, the filter is reset and the box is unchecked again.
This is why in ZBX-18261 we are requesting a global setting that would allow this box to be always checked by default. (It has to be a setting, because people who don't have a problem with Latest Data performance, might prefer it the way it works now)
|
|
Hi Ivanov,
Thanks for the quick answer.
The idea of making this configurable is something I've personally suggested in this comment
https://support.zabbix.com/browse/ZBX-18071?focusedCommentId=454342&page=com.atlassian.jira.plugin.system.issuetabpanels:comment-tabpanel#comment-454342
And I'm glad to hear it's finally being considered
|
|
To be clear, I'm not on the Zabbix dev team - I'm just a user participating in the discussion.
It was suggested more than a few times, but as far as I am aware, there have been no indications from the team whether this is being considered, or not.
|
|
Hello stefano.mendola,
This issue is reported and hopefully will be fixed in ZBX-18265.
|
Generated at Tue Apr 01 04:09:04 EEST 2025 using Jira 9.12.4#9120004-sha1:625303b708afdb767e17cb2838290c41888e9ff0.
