|
No mention of platform, but I want this on Linux.
|
|
related items, suggested in duplicate ZBXNEXT-559 - utime & stime
|
|
we have got a workaround for this, but i think that it's a very interesting feature
|
|
There are many workarounds using diff utils, but they are not stable and handy in usage. Will appreciate much for such a feature!
|
|
Hello,
Do you already know which approach will you use to monitor the cpu usage?
The "ps" approach is to calculate the cpu usage based on how long has that process lived.
The "top" approach is to calculate the cpu usage based on the cpu usage change in the intervals it runs (I guess taking jiffies from /proc/stat and /proc/<pid>/stat)
I would personally prefer the second approach because the first one for me is pretty much useless..
This is a very important (missing) feature for zabbix. Do you have any estimation on when you will add it to the zabbix agent?
Regards
Alessandro
|
|
maybe both (current & overall) percentage are needed then, with an item parameter to switch between them
|
|
We really need this too in the same manner of 'proc.mem[<name>,<user>,<mode>,<cmdline>]'.
|
|
Will be easily solvable by oneself via ZBXNEXT-1550 in upcoming major release, if not implemented natively.
|
|
I've got a workaround that seems to work well for now (on Linux at least). It uses the processname ($1) and username ($2) for the process as parsed variables.
UserParameter=proc.cpu[*],TOTAL=0; for PROC in `/bin/ps u -C $1 | /bin/grep -e '^$2' | /usr/bin/awk '{ print $$3 }'`; do TOTAL=`echo "$TOTAL $PROC" | /usr/bin/awk '{print $$1 + $$2}'` ; done; echo $TOTAL
I was a bit surprised that the agent couldn't handle this out of the box 
|
|
Alternative implementation that requires less forking and is faster for proc.cpu[]. It also allows for proc.cpu[,root]!
|
|
This one probably says a lot more than %cpu from ps, see manpage!
Add this as as a "Delta (speed per second)" item, unit is %. It resembles the share of CPU time consumed by all matching processes, normalized towards the available CPU capacity.
|
|
The cputime item has severe weaknesses witch Apache-like daemons. One could try to store the resulting PIDs, join the previous PIDs with the current ones and submit the delta/time directly.
|
|
This form allows for matching user names up to 32 characters long instead of the default 8:
|
|
Attached file zbxNext494.c introduces a new item key proc.cpu as a loadable module. introduces a new item key proc.cpu as a loadable module.
The code is not really tested yet and I'm quite unsure whether it's logically correct at all.
However, it's a first attempt and could possibly be a first step.
The item returns total CPU (core) time in percent used by process(es) running under some user:
proc.cpu[<name>,<user>,<cmdline>,<sampletime>]
name - process name (default is “all processes”)
user - user name (default is “all users”)
cmdline - filter by command line (it is a regular expression)
sampletime - time between samples. (timeout >= sampletime >= 0.01, default: 0.5)
|
|
but sometimes data is broken (CentOS6.6, Debian 7/8):
usr@zabbixsrv1:~$ zabbix_get -s 10.10.40.167 -k proc.cputimetest[]
1234425
usr@zabbixsrv1:~$ zabbix_get -s 10.10.40.167 -k proc.cputimetest[]
1.23444e+06
usr@zabbixsrv1:~$
may be best choise is:
.... SUM+=86400*d[1]+3600*t[1]+60*t[2]+t[3]}} END ''{printf "%.1f\n", 100*SUM/$$CPUS}'
|
|
Fixed in development branch svn://svn.zabbix.com/branches/dev/ZBXNEXT-494
|
|
(1) the spec does not mention any limits - i would strongly suggest to add a limit, even if it's hardcoded. something like 100 processes or so.
reason - quite often users ask about risks of placing zabbix agent on a system - can it start to use resources without limits ?
this would be a massive possibility in that direction. a runaway lld could create many items and agent would use more and more resources...
wiper The data collection design was changed so that adding new queries will result in little resource usage increase.
sandis.neilands
- Memory impact: approx. 20MB increase per each 1000 queries in collector. Total (virtual) memory usage for collector at 10000 queries is approx 350MB.
- Collector CPU usage on lightly loaded system (250 processes) with 10000 queries is around 1% but it reached 4% while adding queries.
- Still with 10000 queries but additional 1000 processes collector's CPU usage rises to 60%. Most of it in user space.
- RSS memory usage of collector with 2 queries and 10000 processes is about 15MB (process snapshots approx. 12MB).
wiper we contemplated adding a warning message in the case processing time for one loop exceeds the data gathering interval (1 sec), but decided against it.
CLOSED
wiper after discussion it was decided to have the same hardcoded query limit as disk stats - 1024 queries.
REOPENED
wiper RESOLVED in r55166
sandis.neilands CLOSED. Tested on Linux Mint. With 1024 queries (including proc.cpu.util[]) and 10000 processes VIRT memory for collector didn't exceed 130MB, RES didn't exceed 25MB. CPU utilisation: 50% - 60% of a core on fairly recent Intel Xeon CPU.
|
|
(2) Suggestion to order parameters consistently, currently proc.mem and proc.cpu.util:
- proc.mem[...,<mode>,<cmdline>,...]
- proc.cpu.util[...,<cmdline>,<mode>,...]
How about switching state and mode in proc.cpu.util so it matches proc.mem:
- proc.cpu.util[<name>,<user>,<mode>,<cmdline>,<state>,<scope>]
- proc.mem[<name>,<user>,<mode>,<cmdline>,<memtype>]
wiper for proc.cpu.util and proc.mem the mode has different meaning, it's just the naming that maches. Also when if you look at proc.num - the third parameter is <state>, which is closer to the meaning of proc.cpu.util <type> parameter. And system.cpu.util has the same order of parameters - <type> first, then <mode>.
CLOSED
|
|
(3) Since structure ZBX_COLLECTOR_DATA was modified we need to check that there are no crashes on Solaris and HP-UX due to padding/alignment issues (see ZBX-5382).
Update: see also ZBXNEXT-2895 .
wiper The padding was removed from collector data structure and instead 8 byte alignment is applied during collector data initialization.
RESOLVED in r54704
sandis.neilands I will close this after testing on Sparc/Solaris.
sandis.neilands CLOSED.
|
|
(4) zbx_dshm_destroy() is unused. For segment pages to be freed in kernel we have to detach from the segment after marking it for removal. Otherwise - resource leak.
wiper The shared memory segments should be automatically detached on process exit. However the destroy function call was indeed missing. RESOLVED in r54707
sandis.neilands CLOSED. Indeed, no need to call shmdt() explicitly on exit (see exit() in POSIX).
|
|
(5) The following if statement needs a comment explaining it's purpose. Why 64K? Why shm->size / 2?
        if (shm->size < 64 * ZBX_KIBIBYTE || shm->size / 2 < size)
                shm_size = shm->size + size;
        else
                shm_size = shm->size + shm->size / 2;
wiper The idea was to reduce reallocations and 1.5x is commonly used growth factor in zabbix. However when thinking over such optimizations should not be done by the low level API like zbx_dshm_*. So removed it.
RESOLVED in r54721
sandis.neilands CLOSED. Also as discussed - after reallocation we should get some additional free space due to obsolete strings, queries not being copied to the new segment.]
|
|
(6) Shouldn't we prefix the shmdt() call with (void) if we are intentionally ignoring the return value? It shouldn't fail with EINVAL unless (a) there is a memory corruption (since we just got the addr_old from shmat()) or (b) something is seriously wrong with the OS.
        if ((void *)(-1) == (addr = shmat(shmid, NULL, 0)))
        {
                shmdt(addr_old);
                *errmsg = zbx_dsprintf(*errmsg, "cannot attach new shared memory: %s", zbx_strerror(errno));
                goto out;
        }
wiper RESOLVED in r55277
sandis.neilands CLOSED.
|
|
(7) Fixed the following issues in r54648. Please review.
- in procstat_alloc() we have to take into account the passed size when
checking whether there is enough space in dynamic shared memory segment;
- taking into account alignment when calculating how much space is needed for
the initial shared memory allocation in procstat_add();
- calling exit() from procstat_alloc() in case there is not enough space in
dynamic shared memory segment (since callers reserve space before allocation).
wiper Thanks, CLOSED
|
|
(8) Fixed a use-after-free problem in r54651. Please review.
wiper We decided to drop freed queries feature. RESOLVED in r54725
sandis.neilands CLOSED.
|
|
(9) Both PROC_CPU_UTIL() functions do not set result in case less than two data samples are available. Shouldn't result be set always?
wiper There is not enough data to calculate the cpu usage, so there is no result to set. In similar cases success is returned without setting result value.
wiper CLOSED
|
|
(10) Collector (sometimes) crashes in case in current monitoring iteration there are many more processes than there were in the previous iteration.
- pids.values_num contain number of PIDs monitored in this iteration (and snapshot).
- Instead we should use number of PIDs of the snapshot saved during previous iteration.
putil = (zbx_procstat_util_t *)bsearch(&qdata->pids.values[i],
- PROCSTAT_SNAPSHOT(procstat_ref.addr), pids.values_num,
+ PROCSTAT_SNAPSHOT(procstat_ref.addr), header->pids_num,
sizeof(zbx_procstat_util_t), ZBX_DEFAULT_INT_COMPARE_FUNC);
wiper RESOLVED in r54795 r54753.
sandis.neilands CLOSED.
|
|
(11) With broad keys (for example, proc.cpu.util[]) processes can go away after collector has built the PIDs list to be monitored but before it reads the CPU usage values. Due to this the item can become stuck in "not supported" state for a long time with the reason "Cannot read cpu utilization data: [2] No such file or directory". With narrow, specific keys this is still a problem if the process is restarted at the aforementioned time.
wiper RESOLVED in r54795
sandis.neilands CLOSED.
|
|
(12) Fixed a regression (crash) introduced in r54648 (7). Please review r54693
wiper CLOSED
|
|
(13) Performance issue: zabbix_agentd walks /proc for each configured query. In essence this is similar to running ps or top for each query. The performance impact is huge when there are a lot of processes (hundreds to thousands) on the system and multiple queries.
wiper RESOLVED in r54795
sandis.neilands CLOSED.
|
|
(14) Even with a single query configured the performance of zabbix_agentd collector is somewhat worse than the top command.
Tested this on Linux (Mint) but suspect that the situation might be similar on Solaris.
Test #1: specific query
Query: proc.cpu.util[top,sandis,system,top -d 1,avg1]
Steps.
1. Disable all other queries.
2. Restart zabbix_agentd to purge any pre-existing queries.
3. Spawn many processes with the following script (leave it running).
#/bin/sh
while true
do
	for i in `seq 10000`
	do
		sleep 120 > /dev/null &
	done
	echo "spawned 10000 procs, waiting for them to exit"
	sleep 120
done
4. Run 'top -d 1', when it launches press 'c' to show full command line of the monitored programs.
5. Get summary of syscall use for both top and zabbix_agentd collector with the command 'time strace -c -p <PID>' (run it simultaneously for both programs).
$ time sudo strace -c -p 5988
Process 5988 attached
^CProcess 5988 detached
% time     seconds  usecs/call     calls    errors syscall
------ ----------- ----------- --------- --------- ----------------
 45.12    8.666539           2   5120875         2 open
 26.50    5.089424           1   6813464         1 read
 13.58    2.608658           1   5121089           close
  7.72    1.482145           1   1707672       569 stat
  6.97    1.338235         700      1911           getdents
  0.04    0.006951           0     16926           alarm
  0.03    0.004856           0     11284           fcntl
  0.02    0.004369           0     11284           rt_sigaction
  0.02    0.004335           3      1417           write
  0.01    0.001101           5       218           pselect6
  0.00    0.000885           4       218           openat
  0.00    0.000457           0       992           lseek
  0.00    0.000285           1       217       217 access
------ ----------- ----------- --------- --------- ----------------
100.00   19.208240              18807567       789 total

real	7m53.556s
user	0m16.446s
sys	1m34.527s
$ time sudo strace -c -p 14238
Process 14238 attached
^CProcess 14238 detached
% time     seconds  usecs/call     calls    errors syscall
------ ----------- ----------- --------- --------- ----------------
 33.72    7.613751           3   2957813       699 open
 25.76    5.816314           1   4417108           read
  8.78    1.982778           1   2956921           munmap
  7.40    1.671839           1   2956922           mmap
  7.19    1.623952           1   2957308           close
  6.01    1.358164           0   2956922           fstat
  5.83    1.315385           0   2957115           lseek
  5.28    1.191364         716      1664           getdents
  0.02    0.005503          29       192           nanosleep
  0.01    0.001571           1      2700           semop
  0.00    0.000152           0       384           rt_sigprocmask
  0.00    0.000134           1       193           openat
  0.00    0.000074           0       192           rt_sigaction
  0.00    0.000005           5         1           restart_syscall
  0.00    0.000000           0         2           socket
  0.00    0.000000           0         2         2 connect
------ ----------- ----------- --------- --------- ----------------
100.00   22.580986              22165439       701 total

real	7m53.634s
user	0m19.194s
sys	1m51.415s
Test #2: broad query
Query: proc.cpu.util[]
Otherwise the test is the same as test #1. With this test the results are about the same as with top however top manages to get much more information using the same resources.
$ time sudo strace -c -p 5988
Process 5988 attached
^CProcess 5988 detached
% time     seconds  usecs/call     calls    errors syscall
------ ----------- ----------- --------- --------- ----------------
 36.75    5.229229           1   4148473           open
 29.75    4.232834           1   5519907         1 read
 15.46    2.199391           1   4148643           close
  9.25    1.315866         870      1513           getdents
  8.65    1.231523           1   1383358       420 stat
  0.04    0.005719           0     13260           alarm
  0.03    0.003935           0      8840           fcntl
  0.02    0.003543           3      1096           write
  0.02    0.003508           0      8840           rt_sigaction
  0.02    0.003472          20       171           pselect6
  0.01    0.000728           4       171           openat
  0.00    0.000378           0       775           lseek
  0.00    0.000201           1       170       170 access
------ ----------- ----------- --------- --------- ----------------
100.00   14.230327              15235217       591 total

real	6m11.176s
user	0m12.920s
sys	1m19.086s
$ time sudo strace -c -p 9210
Process 9210 attached
^CProcess 9210 detached
% time     seconds  usecs/call     calls    errors syscall
------ ----------- ----------- --------- --------- ----------------
 54.38    7.765692           1   5417329      3436 open
 22.49    3.211848           1   5414110           close
 12.07    1.723370           1   1803021           read
 11.03    1.574413         800      1968           getdents
  0.01    0.001625           1      3038           semop
  0.01    0.001392           6       216           nanosleep
  0.00    0.000674           3       217           fstat
  0.00    0.000510           2       217           mmap
  0.00    0.000290           1       217           munmap
  0.00    0.000196           0       434           rt_sigprocmask
  0.00    0.000179           1       217           openat
  0.00    0.000098           0       217           rt_sigaction
  0.00    0.000014          14         1           restart_syscall
------ ----------- ----------- --------- --------- ----------------
100.00   14.280301              12641202      3436 total

real	6m11.281s
user	0m11.523s
sys	1m3.662s
Suggestions
- The reason for spending so much time in mmap() and munmap() calls is that in collector we use FILE functions such as fopen(), fread(), rewind(), fgets(), etc. On Linux (glibc) these functions allocate buffer for stream manipulation using mmap(). Instead we could use plain open(), read(), etc. as in top command.
- It seems that on Linux /proc/<PID>/* files have the process owner, group. Do we have to read these from files if we already do fstat()? How is it done in top?
- If we do not change our polling strategy (see (13)) to the one of top command (get everything, then decide what is needed for which query), then there is no reason to open status and cmdline files when we know that for current query user name and/or command name and command line will not be checked.
- Since we are getting CPU usage from /proc/<PID>/stat we might as well get the process name from there instead of reading it from status and cmdline.
wiper RESOLVED first 3 items in r54795. Regarding the 4th - the /proc/<PID>stat also has truncated file name. So we must keep the current method.
sandis.neilands CLOSED first 3 items. Let's discuss the 4th item in a separate sub-issue. Reading from /proc/<PID>/status has severe performance impact.
|
|
(15) CHelpItems.php - change
'key' => 'proc.cpu.util[<name>,<user>,<state>,<cmdline>,<mode>,<scope>]',
to
'key' => 'proc.cpu.util[<name>,<user>,<type>,<cmdline>,<mode>,<scope>]',
as in specification?
<richlv> Note that the item key helper since 3.0 is supposed to be completely matching what's in the manual : https://www.zabbix.org/wiki/PHP_coding_guidelines#Item_key_helper
wiper RESOLVED in r54803
sandis.neilands CLOSED.
|
|
(16) This constants must be defined in other way
#define ZBX_PROCSTAT_CPU_USER                 1
#define ZBX_PROCSTAT_CPU_SYSTEM               2
#define ZBX_PROCSTAT_CPU_TOTAL                3
#define ZBX_PROCSTAT_CPU_USER                 0x01
#define ZBX_PROCSTAT_CPU_SYSTEM               0x02
#define ZBX_PROCSTAT_CPU_TOTAL                (ZBX_PROCSTAT_CPU_USER | ZBX_PROCSTAT_CPU_SYSTEM)
wiper RESOLVED in r55091
sandis.neilands CLOSED.
|
|
(17) proc_get_process_uid() should not return 0 in cases of stat(2) error. 0 is a valid PID for the root user. If stat(2) failed on /proc/<pid> then there is no point in continuing with the current process as probably it went away since we read the directory entry.
wiper RESOLVED in r55099
sandis.neilands CLOSED.
|
|
(18) We read process name from /proc/<PID>/status file. Apparently it is very expensive in terms of system time to do so.
Test
Queries
proc.cpu.util[,zabbix,system,zabbix_agentd: collector,avg1]
proc.cpu.util[,zabbix,total,zabbix_agentd: collector,avg1]
proc.cpu.util[,sandis,system,top -d 1,avg1]
proc.cpu.util[,sandis,total,top -d 1,avg1]
Steps
1. Disable all other queries.
2. Restart zabbix_agentd to purge any pre-existing queries.
3. Spawn many processes with the script from (14) (leave it running).
After a few minutes modify any of the queries to contain process name.
proc.cpu.util[zabbix_agentd,zabbix,system,zabbix_agentd: collector,avg1]
The system time of zabbix_agentd collector jumps immediately. On my system - from 4% to 12% CPU utilisation.
Suggestion
Presumably the process name can be read from /proc/<PID>/stat file with less performance impact however there might be backwards compatibility reason for not doing that. Further discussion/investigation needed.
wiper RESOLVED in r55099
sandis.neilands
CLOSED.
|
|
(19) On Solaris (SPARC) I get the following new warnings.
proc.c:528: warning: unused variable `usrinfo'
proc.c:647: warning: implicit declaration of function `getzoneid'
proc.c:620: warning: unused variable `dir'
proc.c:621: warning: unused variable `entries'
proc.c:623: warning: unused variable `tmp'
proc.c:624: warning: unused variable `pid'
proc.c:624: warning: unused variable `fd'
proc.c:625: warning: unused variable `psinfo'
proc.c:672: warning: control reaches end of non-void function
wiper RESOLVED in r55090
sandis.neilands CLOSED.
|
|
(20) On Sparc/Solaris using ZBX_DEFAULT_INT_COMPARE_FUNC for bsearch in procstat_calculate_cpu_util_for_queries() leads to bsearch() always returning result for PID 0.
This is because qdata->pids.values[i] is 64bit integer. When we cast its pointer to pointer to 32bit integer in ZBX_DEFAULT_INT_COMPARE_FUNC on big endian machine and then dereference the pointer we get 0.
Possible solutions:
- custom comparator function;
- saving value in a temporary variable before passing it to bsearch();
- creating and using 32bit integer (or better yet - native pid_t size) vector macros for storage of pids.
wiper RESOLVED in r55089
sandis.neilands CLOSED.
|
|
(21) Optional. While currently size of zbx_procstat_util_t is 8 bytes (perfectly aligned) it could change in the future. It would be best to take care of the alignment of this structure since we are using it in array.
wiper More detailed investigation showed that the compilator correctly aligns structure size depending on its contents. So the only time when we must bother about structure size alignment is if we are using our own memory allocators.
CLOSED
|
|
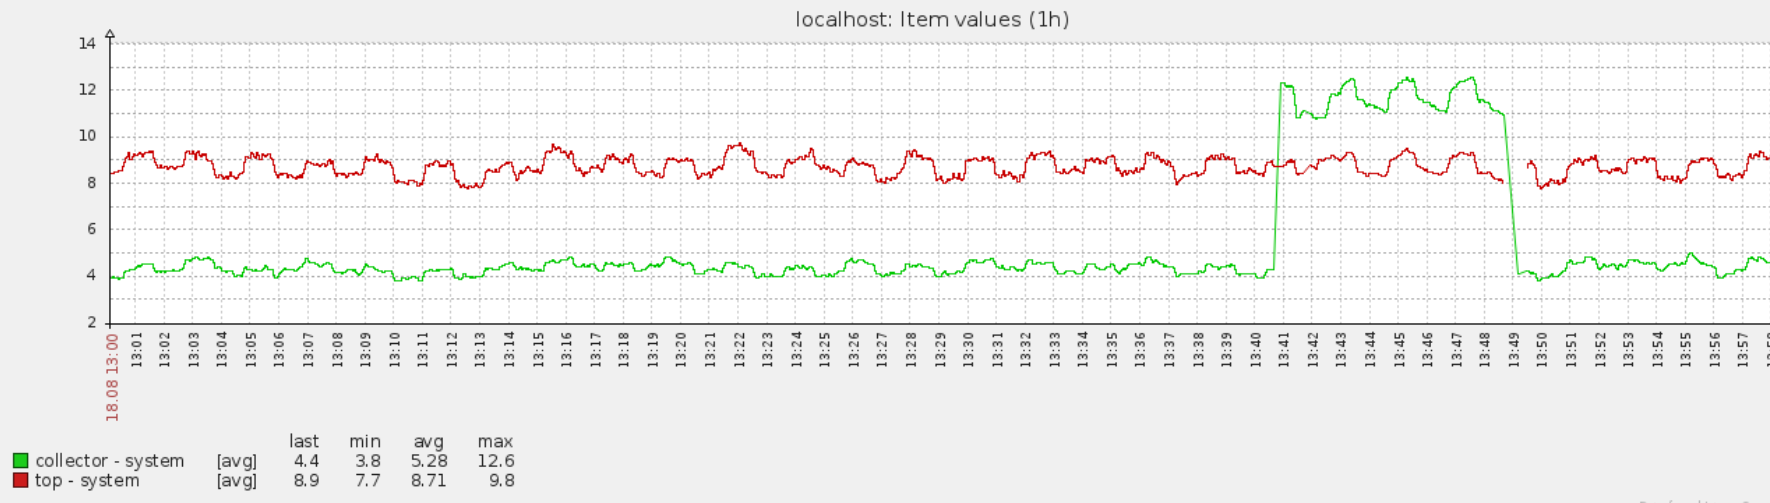
(22) On Sparc/Solaris the results returned by Zabbix differ significantly from top.
On Solaris top gets its readings from /proc/<PID>/psinfo which contains total CPU time for process. We should take a look how top calculates percentages from this.
# uname -a
SunOS zbx21 5.10 Generic_118833-36 sun4v sparc SUNW,Sun-Fire-T1000
10441 zabbix 1 59 0 4400K 2896K cpu/22 0:00 0.01% top
# ./zabbix_get -s 127.0.0.1 -p 20053 -k 'proc.cpu.util[top]'
0.200000
wiper I tried testing the development branch version with fixed subisue (20). The results seemed close enough to the prstat utility.
sandis.neilands When top calculates per process CPU usage it takes into account the number of virtual CPUs on the system. wiper tested the solution on a system with a single virtual CPU, this is why the values from Zabbix and top matched.
Example: if one process is using one virtual CPU 100% on a machine with 24 virtual CPUs then top shows 4.17% CPU usage for this process (100 / 24 == ~4.17). prstat without parameters will show similar number.
In our solution we do not take into account the number of virtual processors thus output from Zabbix should be compared to output from procstat -v.
The consequences.
1. Depending on the query Zabbix can report huge percentages on systems with many virtual CPUs. On SPARC-M6 - up to 3072 virtual CPUs (source), e.g. 307200 %. This means that users have to calculate the actual, system-wide CPU usage of the process by dividing value reported by Zabbix with number of virtual CPUs.
2. The administrators can change the number of virtual CPUs, disable and enable CPUs in runtime meaning that readings can jump around suddenly.
3. The virtual CPUs can be grouped in various ways. Perhaps in the future we should provide a way to monitor process CPU usage within group.
4. system.cpu.util gives the total CPU time consumption of the system, e.g. it's always <= 100%.
sandis.neilands CLOSED after internal discussion. We'll have to document this behaviour though as it will not be obvious to Solaris users.
|
|
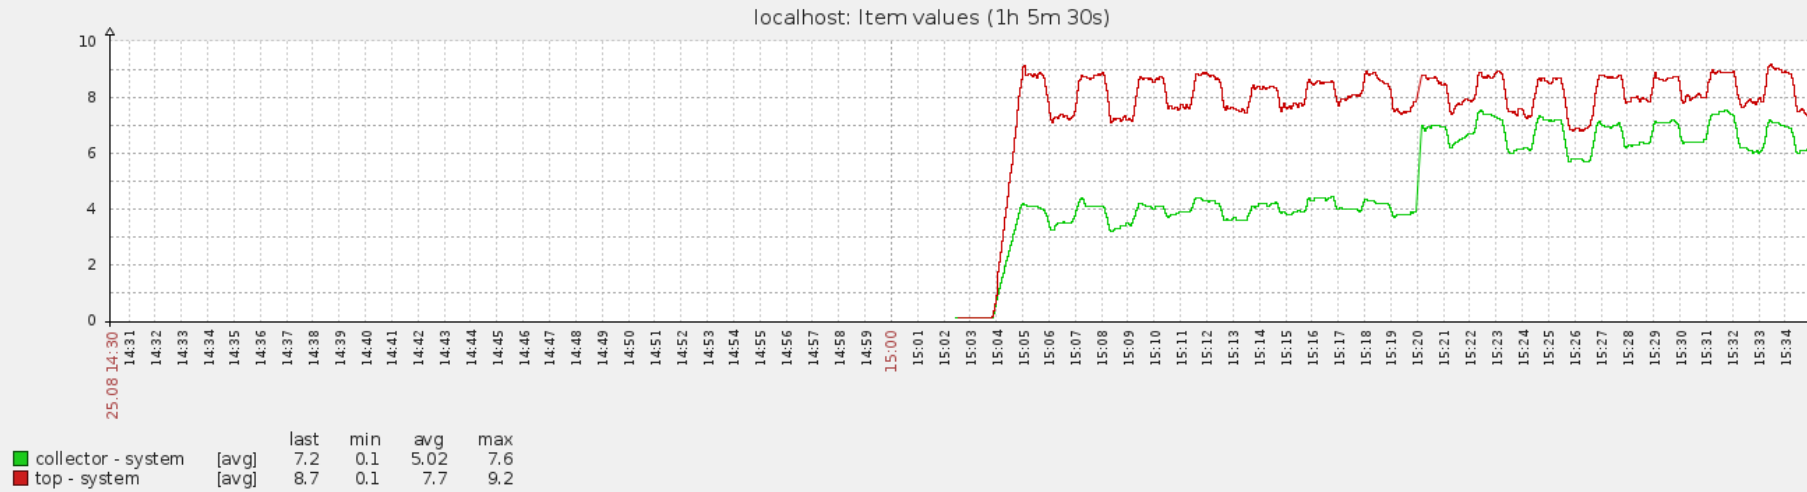
(23) Optional. Performance issue on Sparc/Solaris - collector uses significantly more resources than prstat with similar parameters. There are around 1500 processes on the system.
   PID USERNAME USR SYS TRP TFL DFL LCK SLP LAT VCX ICX SCL SIG PROCESS/NLWP
 10442 root     5,4  39 0,0 0,0 0,0 0,0  56 0,0   4   6 10K   0 zabbix_agent/1
 29299 root     4,3  11 0,0 0,0 0,0 0,0  84 0,0   3   3  3K   0 prstat/1
Processes generated with the following script.
#/bin/sh

while true
do
        sleep 7 > /dev/null &
done
You can use truss -c -p <PID> command as a root user to troubleshoot this performance issue similarly as with strace on Linux.
It seems that prstat keeps the file descriptors around and then uses pread() on the same descriptor multiple times. It calls open() and close() only for new or closed processes.
sandis.neilands CLOSED after internal discussion. This can be done in a separate ZBXNEXT if needed.
|
|
(24) When a new query is added and shared memory segment has not enough free space, the shared memory segment is reallocated to <current size> + <query size>. It should be <used size> + <query size>.
wiper RESOLVED in r55164
sandis.neilands We can improve characteristics of query removal.
- Periodic reallocation will decrease memory usage when queries are removed.
- What is the safe maximum update interval in fronted for proc.cpu.util items? We don't have to keep queries longer than that. The current limit of 24h is actually too short for the max update interval.
wiper checking process cpu utilization once per day or even once per hour does not make much sense. So 24h invactivity period should be enough. Of course we have to properly document it.
wiper added inactive query cleanup once per day.
RESOLVED in r55184
sandis.neilands CLOSED.
|
|
Released in:
|
|
Documenation:
wiper Documentation should clarify that it's CPU utilisation relative to single cpu (core).
sandis.neilands Also we should mention the maximum supported interval: 24h. This is less than the maximum configurable item interval time in fronted.
wiper Updated proc.cpu.util comments to mention that CPU utilisation relative to single cpu.
https://www.zabbix.com/documentation/3.0/manual/config/items/itemtypes/zabbix_agent
sasha <type>, <mode> and <zone> must be described in Items supported by platform
REOPENED
wiper Added <type>, <mode>, <zone> parameters to items supported by platform page:
https://www.zabbix.com/documentation/3.0/manual/appendix/items/supported_by_platform
RESOLVED
sasha CLOSED
|
|
(25) Fix issues found by Coverity scan. Mostly false positives, but would be nicer to get clean scan (also the code would be more robust and less possibilities from introducing bugs in future).
sandis.neilands See the attached file coverity_defects.eml. Brief summary of defects.
CID 130102: if the query doesn't filter by user then uid is indeed uninitialized.
CID 130101: false positive - we have a loop that walks the buffer backwards and marks the end of string when we find ')' or at tmp[0] otherwise.
CID 130100: off-by-one write in array.
CID 130099: if shm->shmid is ZBX_NONEXISTENT_SHMID and shmat() failed then indeed we use uninitialized pointer in shmdt().
CID 130098: see (6) in ZBXNEXT-494. Better to add (void) prefix to silence this CID.
wiper RESOLVED in r55277
sandis.neilands 0 UID will match root's processes. Instead we can use reserved value -1 to indicate unused UID. From setreuid(2): "Supplying a value of -1 for either the real or effective user ID forces the system to leave that ID unchanged."
wiper changed the default (unused) uid value to -1 in r55323
sandis.neilands CLOSED.
|
|
(26) translatable string changes ?
wiper
Added translation strings:
- Process CPU utilisation percentage. Returns float.
- CPU utilisation percentage. Returns float.
Removed translation strings:
- CPU utilisation in percent. Returns float.
RESOLVED
<richlv>
- manual says "Process CPU utilisation percentage", frontend has "Process CPU utilisation in percent" - let's decide which one is more correct and unify them
- active item listing uses key like this : proc.cpu.util[<name>,<user>,<state>,<cmdline>,<mode>,<scope>]
manual and passive listing has "type" for the third parameter and "zone" for the fifth
wiper It was copied from system.cpu.util, although most places has 'in percentage'
Fixed active item description in r55294
Martins voted for "Process CPU utilisation percentage".
Currently 'percent' is mentioned in the following help items:
Process CPU utilisation in percent. Returns float
CPU utilisation in percent. Returns float
Swap space size in bytes or in percentage from total. Returns integer for bytes; float for percentage
Number or percentage of inodes. Returns integer for number; float for percentage
Disk space in bytes or in percentage from total. Returns integer for bytes; float for percentage
Memory size in bytes or in percentage from total. Returns integer for bytes; float for percentage
Returns percentage of lost ICMP ping packets.
Time a particular Zabbix process or a group of processes (identified by <type> and <num>) spent in <state> in percentage.
Should we change them to keep the same pattern?
wiper Renamed system.cpu.util description (in percent -> percentage)
RESOLVED in r55323
<richlv> thank you, looks good. i guess the new translatable string is this ?
- Process CPU utilisation percentage. Returns float
if that's it, CLOSED
|
|
Released in:
|
|
This feature caused a minor issue ZBX-10107.
|
|
Solution does not compile on Solaris 9 ZBX-10548.
|
|
Let me leave here a comment related to windows:
I tried this https://blogs.msdn.microsoft.com/vijaysk/2012/10/26/tools-to-simulate-cpu-memory-disk-load/ on a Win7 vm host with 2 CPU cores.
Looks like my "\Process(CPUSTRES)% Processor Time" performance counter reflect the CPU util from task manager, but the perf counter value should be divided by number of CPU cores.
So when my CPU was 75% utilized - the counter showed 150, when CPU 100% - counter 200. It was not possible to get value more than 200 for the counter.
When added 2 more cores (4 in total) - the maximal value became 400, as expected. The linear progression (number of cores multiplies the counter value) is still confirmed.
So, I'd say that the counter could be used to monitor CPU util by a process, but I cannot be sure its results are correct for any CPU usage pattern, who knows ...
|
Generated at Sun Jun 14 04:01:30 EEST 2026 using Jira 10.3.18#10030018-sha1:5642e4ad348b6c2a83ebdba689d04763a2393cab.