|
Preferably, availability of active/passive mode would be visualised separately.
|
|
Great idea!
|
|
It will be great, if Host's API property 'available' will be work for active agents. And I can get information about all working agents through the API.
|
|
As we use mostly active agents that are behind firewalls, this would be a welcome addition.
|
|
Also, the "unknown" status is set for a host that does not have a zabbix agent installed and a template with trappers only is connected to it. This is inconvenient because in fact, everything is in order with the host and it sends the correct data, and all the accessibility icons are gray and this host is in the status "unknown"
|
|
Since we don't currently have indicator for trapper items this would require introducing a new one. But since current indicators relate to a certain type of agent, I guess a "trapper icon" wouldn't fit well in there. Looks like a separate feature request anyway.
|
|
This would be great in fact. In my case I have the following scenario:
| -------------------------------------------------------- LAN -------------------------------------------------------- |
---------------------------------------------- CLOUD ---------------------------------------------- |
|
| Zabbix Agents (active checks only) -----> Zabbix Proxy (active) -------------------- |
------------------> Zabbix Server / Frontend |
| -------------------------------------------------------- LAN -------------------------------------------------------- |
---------------------------------------------- CLOUD ---------------------------------------------- |
|
When I access the Zabbix frontend in the cloud, I can see that data has been received but cannot see the availability of our hosts. Zabbix could show active check agents as available as long as data is being received from the proxy in some time window.
|
|
Yes, please, agreed, totally +1
|
|
Voted +1. This would be great feature for active check 
|
|
I like this idea, but setting up for active agent only seems pretty incomplete. We have ~20 different protocols to choose from and only showing 4 of them is far from ideal.
If you setup a host with ping/active agent/http/snmp trap/odbc/jmx, you have no idea whether its working or not by looking at that current display.
On the other hand, dynamically showing all protocols tends to be slow/messy on bigger environments.
|
|
Can someone explain the logic behind the current behaviour? I don't think the situation is any different between active and passive, in both cases: exists valid communication within time limit = host available, I really do not see why an how active communication should be treated differently? The supposed (by me) argument that server has to wait for the communication from agent has not solid ground since the amount of time needed to wait is well determined just as is for passive checks. And frankly, does one failed passive check necessarily mean that the host is not available or that its state is unknown? Unknown state is actually quite dumb name since what is the difference between unavailable and unknown if the communication with the agent cannot be estabilished.
This really needs to be fixed, otherwise active checking is pretty useless (unknown state means a problem...)
|
Can someone explain the logic behind the current behaviour?
I can. Active agent does not have a heartbeat message which could be used to determine if it's working properly. Zabbix server does not know interval at which active agent is supposed to request list of configured checks, because this setting is in agent's configuration file. It is perfectly fine to have no active checks with a set interval in host's configuration, e.g. active agent can be used solely for log monitoring. And if your log monitoring loos for pretty rare events, active agent can have no reason to communicate with server for very long periods of time.
|
|
This makes sense but, according to the manual, App-5-3:
The servers to get the active checks from are listed in the 'ServerActive' parameter of the agent configuration file. The frequency of asking for these checks is set by the 'RefreshActiveChecks' parameter in the same configuration file. However, if refreshing active checks fails, it is retried after hardcoded 60 seconds.
And by App-3, the option RefreshActiveChecks is between 60 seconds and 1 hour. So at minimum every hour, you have a heart beat, even if you are doing as you suggested, there will be a communication. That is provided I read the manual correctly.
|
|
And that's what is asked here. Use existing message exchange to detect active agent availability. Currently this is not implemented.
|
|
Vote +1
We need it for our Industrial IoT components , there is only ICMP availebil! Our tec's have no idea what "Unknown" means for a host. I think also customers have no idea or can't remember how many unknown hosts there was last week.
Solution may be a Host Interface type "Host" or "ICMP only" with check on one or better x IPs for Industrial components with a backup network.
In Industrial environments are often no 3rd party agents allowed on systems, also a lot of customers do not want to use SNMP for security reasons or Automation controller geeting stuck when SNMP request are send... thats a bad firmware issue i know but thats a point why not to use SNMP.
The Unknown state means to me there is a non configured device or a new discoverd host in my network.. and may be a security reason in the worst case.
|
|
+1 for IoT scenarios. To be able to query the host 'available. status via the API for ICMP ping would be a huge benefit rather than having to run a complex SQL query. We have over 5000 ICMP-only devices.
|
|
also voted +1
there are a lot of setups where only active agents are used because of various reasons, such as potential security risk of allowing monitoring server to access hosts, or firewall setup not allowing inbound connections to agent host (such as agents located in customer sites).
like others have previously mentioned the active checks can be used as a heartbeat for the agent availability status. this could be a server-side parameter to make it independent of agent configuration. maybe somewhere in the settings there can be a timeout parameter, then one could set f.e. 10 minutes for the timeout and if the active agent doesn't send any data within that time, the availability could turn " Not available" or "Unknown".
|
|
Good points there! Let's hope this gets implemented at some point.
|
|
Definitely a must have!
|
|
Markus: "Solution may be a Host Interface type "Host" or "ICMP only" with check on one or better x IPs for Industrial components with a backup network."
Yes, that is the best solution!
|
|
This feature is for "Active Agents" ICMP does not apply.
|
|
This is such an important feature that unless it is added I can't even use Zabbix to monitor my network. I have a lot of hosts behind firewalls and have to use the active agent to avoid changes to firewall. It seems to trivial to implement this given that the agent already phones home from time to time (I read some of the reasoning above but the agent could easily send a periodic heartbeat message even if there are no events to report). I wrote this functionality into Microwave radio agents and an NM system 20 years ago... it's not hard
Please please please add this.
Thank you.
|
|
LCC IMHO We all shouldn't forget, that Zabbix is about seeing what's wrong, and not what's right. I see that this is an important missing feature. But not that important that I would understand the hype.
> that unless it is added I can't even use Zabbix to monitor my network.
I honestly don't believe this. Active and Passive Agents for rocking stable since 1.8/2.0 Zabbix era. Only missing point is the Green Indicator, but who is interested if 99 Switches are Green and one is red? Isn't the Red one the only one that should really bother you?
|
|
While "unless it is added I can'r even us Zabbix to monitor m network" may be a bit hyperbolic. You only focus on the red/green box. While a visual cue is important and should not be so easily dismissed, there is also the important aspect of the "online/offline/unknown" state which can quickly be visualised and queried via the API and other external integrations.
|
|
Marco, Gavin, thank you for your comments. I understand your points. Yes, I was being a bit hyperbolic perhaps However, the point remains: it is inconsistent. If the passive agent shows ZBX green then why can't the active agent? Please remember that everyone uses different products in different ways and everyone has different ways of operating. In my case, since the bulk of my monitored devices are a) Servers and b) WAN-based (behind firewalls), it is very important to me that I can open the phone app (or browser), do a quick visual scan and see "all greens".
It's hard for me to understand the opposition to this. If there is a set of people that "don't care" if the active agents show green, and there is a set that do, AND the passive agent already shows green; then what's the problem with the active agent showing green?
Not trying to bloviate or boast, but was lead designer of UIs for carrier-class wireless network management systems for almost 15 years. There were typically four states that we dealt with: error, warning and informational plus unknown or undefined. The later meant a network device had never checked in since creation and that was cause for alarm (or perhaps had not yet been physically configured in the field). If we had left "alive" radios showing "unknown" there would have been hell to pay from our customers!
|
|
+1 for this, it's an important feature to have for both passive and active otherwise the hosts are reported as unknown, on a large scale setup this is a major issue.
|
|
Another +1 over here, it would be wonderful to have this feature on Zbx 6
|
|
+1 to have a better picture of all agents that are active.
|
|
+1 it is a very confusing scenario, with grayed out availability
|
|
+1 for this feature
|
|
+1 I wonder what the logic was for this. I have to add zabbix passive calls just to get the little green light.
|
|
+1 Many other systems that are behind a firewall communicate with a central point of operations for a "CONNECTED" or "DISCONNECTED" state.
|
|
+1 for this feature
|
|
I hope this is added soon, active checks are so much nicer from a security point of view. So it sucks you have to live with the missing part of the setup
|
|
I think it is a lost cause... the developer seems to just ignore this request. In fact, I was reading elsewhere where the developer was arguing against it for some reason and being rude about it... I don't have the energy to look for it now. But, in the end, it's a real shame because this is the ONE SINGLE issue that prevents me from adopting this platform.
|
|
Having this is critical for me. Im tired of explaining to my Nagios loving coworkers why hosts that have only active agent (in their nomenclature passive checks) are "not green".
Having some kind of timeout counted from last communication from active agnet and/or trapper (zabbix_sender) would be great idea.
Also being able to bind ICMP Ping response to this status would be great (much less stress on my end when talking to Nagios guys). We have ton of things that we only monitor with ping that stay "not green" in dashbords.
|
|
We would also like to see this implemented.
Would a pull request be accepted, which:
- Adds one more column in the "Availability" column in the host config for "Active data" green/red just like for ZBX/SNMP/JMX/IMPI
- On host level add a field for "Active data timeout", which indicates when a host should be put as "Unavailable" when not receiving active data for at least this amount of seconds
|
|
Also for us this feature could be a nice to have, is not "show stopper" but is a great improvement on "user experience" of the monitoring people. As most you already says, is not easy to understand why "active agent" are not showed as a "green" icons like the passive...
Please DevTeam think about it
|
|
I would echo the sentiments of everyone here that there should be a more accurate way to monitor this. While "unknown" is technically accurate that Zabbix cannot confirm 100% the status, it leaves an obvious glaring hole as many have described.
However, I do like @aschild for proposing that we fix the problem ourselves with a pull request.
I am not a good programmer, however, I can help try to resolve this and would be willing to test. Surely we can determine the process and create a suitable fix that everyone is happy with.
|
|
People are often confused by ZBX and assumes that it represents both type checks. ZBA + ZBP instead of ZBX could help to differentiate

|
|
Don't like the idea of having "ZBA" and "ZBP" since this is even more confusing. Probably something like "Last seen: ..." column as for active proxies would be more user-friendly here for active agents?
|
|
Guys, how about not having any icon for specific protocols? How about having an semaphore (green/yellow/red) to indicate all protocols used by that host are ok / some are not / none is working?
One could then click on the host to see whats going on on yellow/red.
We have some ~20 protocols, and having just a few icons is not complete, nor its helpful.
|
|
+1, please add a way to send host status without ZBX. Nowdays scenarios are very common when you are not allowed to install agent, not to speak of snmp / ipmi.
Maybe set host status as a variable from checks? Or add a plus interface "direct" ?
Thank you for your hard work!
|
|
I am curious..... I notice this ticket is "unassigned" so does that mean that anyone at Zabbix is even looking at this? @Sergey Simonenko I am assuming by other tickets you work for Zabbix? If so, can you provide us with some options that we might be able to make this happen by v6?
I am planning a rollout of Zabbix to my company and we will have over 200 machines ALL of which will be active agents. Zabbix will be a dashboard on a TV in our support center and right now, I'll have a Host Availability widget that will show the majority of my agents as "Not Available" and in the RED.
Please try to understand my concerns, Zabbix is a monitoring software that we all love, however, monitoring is about accuracy as well as trying to tell the whole story. I have seen posts and videos from Zabbix Site and YouTube channel discussing how to re-write triggers to mitigate false positives and alerting when there is actually a problem. I feel like this falls in line with that as "Not Available" doesn't accurately doesn't tell the whole story.
Some ideas to consider:
- Include an option in administration to allow "agent ping" as a alternative for "agent availability" in active agents only
- Same option for Host availability widget
If I can help with this in anyway I would be happy to. If we could have confirmation an acceptable pull request could be submitted I'm sure someone here, if not me, could find a way to provide this.
I would appreciate a reply please.
Thank you for you time and consideration in this. We all appreciate the work put in to this project.
|
|
The green agent availability icon requires at least one passive agent check - but you can have the rest configured as active checks. So In the meantime, Until zabbix addresses this massive visual flaw in their dashboards - What I've done to address this for my rollout was
1. Copy the Template OS Linux by Zabbix agent active
2. Unlink 'Template Module Zabbix agent active'
3. Link 'Template Module Zabbix agent'
4. Configure all Linux agents for both active and passive data flow
5. Assign this copied template to all Linux agents
99% of checks are active, save for the few agent checks contained within Template Module Zabbix agent. You can do the same, and create a dummy check if you'd like.
|
|
I would say "We need this feature implemented", after some months all of my customers seems "confused" on how Zabbix manage the availability of the "hosts".
I know is not so huge "feature" but is needed to better figure out the monitored hosts for a "new" Zabbix users.
Please try to find a good solution.
Thanks so much
|
|
So if all your customers need this then im sure you can find one who wants to sponsor this feature 
|
|
Once we know what amount of sponsoring money would be required we could probably gather it.
But so far the responses from the Zabbix team are tending toward: Not needed, won't do it, also won't accept pull/merge requests which implement this
|
|
+1 to @aschild
There is no sign of intent from Zabbix side to implement this even if the costs would be covered.
I guess from the interest, if there would be a reasonable quote for implementing this feature in a given Zabbix version, and a corresponding bounty bucket on any of the popular crowdsourcing platforms, we could gather the money needed.
Until that, we must accept that this is not how the software works, and use as-is, individually patching or working around our needs. My approach was to drop host availability cheks, measurements and reports from my config and focus on service availability instead.
|
|
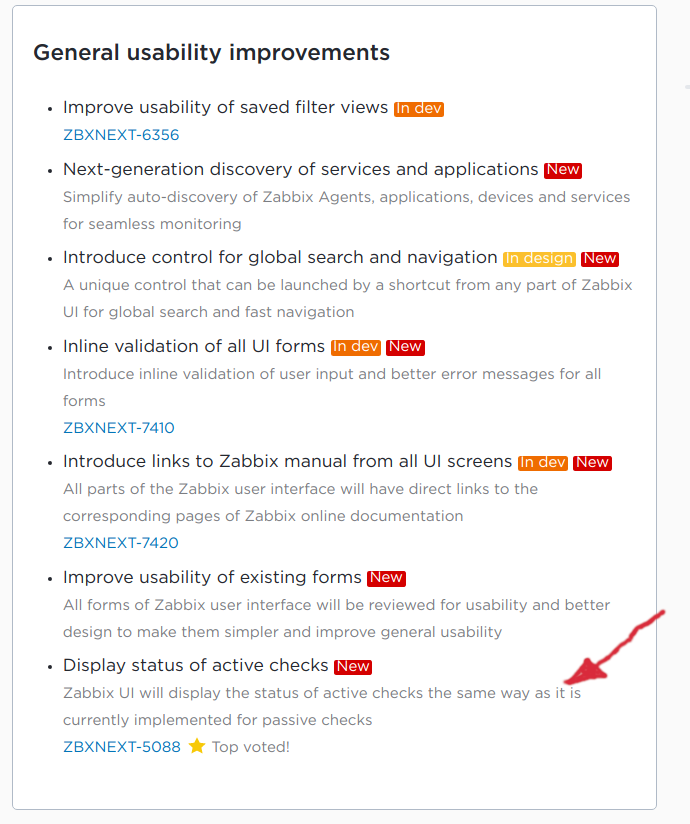
+1 to @aschild & @peter
I'm deal with both guys! but someone from Olympus maybe have look on our "case", please check the "NEW" Zabbix 6.2 roadmap
See the screenshot (ZBXNEXT-5088.png  ) )
Thanks Zabbix Guys!!
|
|
This is wonderful news and I cannot wait to see this included!!!
Thank you to the developers for agreeing to the need in fixing this and to those on this post who kept the topic going!
|
|
@dimitri.bellini: Will this also fix ZBX-8942?
|
|
Sam Fisher, apparently in your haste to be aggressive, you failed to notice that this was being resolved in the next release and is also documented in the manual that this was the way it worked.
I somewhat understand your frustration, however, being aggressive about it isn't usually the way to influence change.
Personally, I've "wasted" many hours before on things that were my fault, dumb mistakes, or misunderstanding the way things work. It is an inevitability.
|
|
+1 to @jwoodard80
Zabbix LLC enables many of us to have a decent monitoring tool, free of charge. They invest in architecting, development, releasing, QA, training etc, it is a rather unpolite thing to make demands on top of that.
|
|
In retrospective I must agree with the both of you Jonathan Woodard and Peter Szabo. I guess my annoyance got the better of me, and I must apologize for that. Thus I have deleted the comment, as I don't want to anger anyone else due to my hasty statement.
Best regards,
Sam
|
|
No worries, it happens to us all.... I can promise you I have felt just like you. I spent a very long time working with user/pass length on HTTP Agents before I figured out they were being truncated.
|
|
OK, here are some good news, this issue went into the planning stage and we're now in the stage of designing this functionality. It's moved forward, stay tuned for more updates!
|
|
Question from community raised: As I understand there will be no separate icon for Active agent? Would it be possible to share the general idea how this will work (perhaps also a mockup)?
|
|
Please make sure that the queue display is corrected at the same time. (ZBX-8942)
|
|
Since we are planning how this will be developed, i'd think carefully how to show this info. I think zabbix agent and zabbix agent (active) should be two different icons, if set up this way. However, we have 20+ different protocols and setting just a few (the most common i suppose) is insuficient.
What do you guys think regarding the protocol status display, at large? I personally believe we should not show static protocols, instead Zabbix should display all of the supported protocols for each host. This could get messy really fast, so display an aggregate status where we are listing hosts (monitoring -> hosts, config -> hosts, etc). All implemented protocols are good, display green. Some are not, yellow. All are not working, red. Show logs when hoovering the mouse, like we do today.
And inside each host, display the full range of implemented protocols for that specific host, like we have today, but just with the protocols it uses (webscenario, odbc, zabbix agent, trapper, snmp, snmp traps, http agent, etc).
This should have been revisited once we removed the need for an interface in each host. Its not mandatory. So why displaing is?
|
|
Since "active" and "passive" traffics are absolutely independent I'd agree that it makes more sense to visualize them separately. Otherwise if one of them stops working I see no way how to correctly display that. Would be also easier to track down configuration problems.
|
|
At first thought I think, every (interface) type that is configured, should be displayed as an icon. If not configured, it shouldn't be shown. Which is already the case I see right now ^^
So adding to my first thought, I strongly agree that Zabbix active and passive should be separate icons. I'm all the way Zabbix agent passive, but sometimes you just have to use Zabbix agent active, for the items that rely on it.
And +1 for dimir: "Would be also easier to track down configuration problems." In the past, I had so many active agent issues, because the spelling in frontend and agent conf was not case sensitive in my config, that might've been of some help.
|
- don't forget the case where users use the agent in active + passive setup
- 1 icon is ok but then it needs to be dynamic like show active or passive or both
- 2 separate icons is probably the more easy approach
- 1 icon split in 2 parts like. active|passive could also be an option
|
|
Just to add a real life example - had a system, was shown as green, BUT the agent config file was misconfigured and the serveractive setting was wrong. Almost all items were active, so no data was received, still shown as green. Took some time to recognize this issue because it looked green.
Therefor the green indication was a bit useless.
Thinking about the current display, I find that the ZBX / SNMP / ... indication in different protocols is not really useful, as anyhow I just want to see if the configured protocols work or not.
So instead of cluttering the host display with 42 icons, I'd suggest that there is only one summary icon per
- green - all configured protocols (ZBX; ... whatever is configured on the host) work
- yellow - one of the configured protocol failed
- red - nothing works
Perhaps additional with hoover on the icon it then shows, which protocols have which state.
|
|
Good point @Guenther i think is not so bad suggestion!
Most of the time we have the same behaviour, the customer is not able to "clearly" understand if the Hosts are monitored or not with a single Dashboard or from the Host View.
So please keep in consideration what @Guenther suggested.
Thanks so much
|
|
I disagree with Guenthers suggestions. (Maybe I understand it wrong? About what view are we talking?)
I just checked my hosts. 99% of my hosts use one interface type. 1% use two interface types. There won't any case, where "42" green icons clutter my interface at once. I want to see, which interfaces are configured and if they are green. I see no need to combine the connection items into one overall connection icon.
|
|
Marco, at least the ZBX has two - active and passive, which can work and fail independently. Also some hosts additionally with JMX, trappers or http. So while it is right for your system, it might not be for others.
And IMHO for you nothing would change, as you still have one icon for your protocol you use. Just no ZBX, SNMP or on it ...
|
|
Okay, thanks for explaining. I think I understand now. The difference seems to be, that I always create one host per protocol and rarely mix, but as you said, that might be just me.
But I still disagree. I'm still team: One icon for each protocol and separate icons for ZBXA and ZBXP.
|
|
i am definitely for having separate icons at least for zabbix active and zabbix passive agent checks and hope the Host availability widget on the default dashboard will show active checked agents as available instead of unknown after this change.
|
|
I agree Stefan Sonneveld.
The feedback channels are different in the architectural sense. It is absolutely necessary to distinguish these 2 elements.The availability check is only really possible with the passive agent, because the data is retrieved (pull). With the active agent, we must remember that we are collecting data and therefore the data comes to the proxy/server. In fact, there is not really a control of availability, but a control on the fact that the data is collected or not. That's very different and I think it's necessary to separate that.
|
|
There's a lot of healthy debate in this thread which is superb. I'd like to make sure we don't lose sight of one of the popular requests that is to change the icon (any icon) status based on a simple check, like icmp. So that we can query an interface status API and get an "up" or "down" instead of an "unknown"
|
|
I would agree with Gavin here... When I came to this ticket my problem was that 95% of my agents are installed active so this means that they all appear "unknown". My hope in this feature was to simply have something that if there is communication via an active check that the agent is marked available. Yes, this is MY use case and I do fully understand that I am a drop in a ocean of users.
I also agree with Guenther regarding the hover. Even though I do not fully understand all of possibilities for the 42 icons, I do like the idea of showing an overview of the states.
My sincere apologies for my ignorance, however, I am curious as to why we cannot have something as shown below. Obviously it is sized large.
This could also have the hover option to show any various others and their state.
(A)ctive (P)assive (S)NMP (I)pmi (J)mx with Green/Red designating the up/down respectively. The final icon could be for any other not in the main 5 offered by zabbix and shown as either (#) of interfaces or (O)ther. This could be red/yellow/green representing down/partial/up. Hovering over the entire section would show an overview as Guenther stated.
This would limit the growth of icons and allow for the main interfaces that are offered.

Have enjoyed the discussion.... Please disregard if my proposal has no merit.
|
|
Please see the requirements document in the attachment: DEV-98868521-170322-1323-162.pdf
(sorry, the formatting is a bit off in a pdf copy)
|
|
Question: Let's say I have an environment, where most of my Zabbix agents are mixed active & passive.
If I now upgrade my Zabbix server and proxies to 6.2 and do not update my Zabbix agents (they all stay <6.2), then all my Zabbix agent Availability icons will turn Grey (unknown), because of Example 1:
Active - Unknown (<6.2), Passive - Available, Result icon - Gray (Unknown)
Is that interpretation right or wrong?
|
|
@starko: I think that is exactly how it should be; older agent, lacking of the newly introduced features... I would be extremely surprised if it works differently for this specific feature.
|
Examples:
1. Active - Unknown, Passive - Available, Result icon - Gray (Unknown)
2. Active - Unavailable, Passive - Available, Result icon
- Yellow (Mixed)
I think this could be great, if not combining just agent avaiabilty icons, but all protocols into one. That's great.
If mixing just agent protocols, and leaving few others on its side (JMX, SNMP, IPMI), and most of other protocols not even mentioned, this is a big mistake. Not only its not user friendly, its also not feature complete.
|
|
starko, yes, this is a correct interpretation.
fpaternot, this task does not aim to redesign the way Zabbix shows availability in general. It addresses one specific point of confusion and it's about active agent availability. Consolidated status across all possible protocols is another endeavor and should be considered separately, imho.
|
|
Kalimulin Thanks for the clarification! Then I have to note, that I strongly disagree with the current specification draft, and would like to propose a change. I believe it's unreasonable to combine the icons for active and passive.
1. For the reason I mentioned. In a mixed environment with hundreds or thousands of working agents <6.2, these feature will turn all the agent icons just grey. It would take months of work to get the now working green icons back. That's a huge drawback. agents <6.2, these feature will turn all the agent icons just grey. It would take months of work to get the now working green icons back. That's a huge drawback.
2. I think a combined item for active/passive is just not helpful at all. Typically these are very different use cases, that also require different troubleshooting. Like others said before me: "It is absolutely necessary to distinguish these 2 elements."
3. Another example: I use 99% passive checks, but for Windows Eventlog Monitoring I have to use active checks. That's okay and the config has to be implemented correctly for it to work. It it is working correctly today, but an agent update is not high on my list, after a Zabbix server upgrade. So all these green items would turn grey. Additionally I would have to check each and every host independently why it's grey. Is it because of active or of passive checks? With a combined icon this is unnecessary complicated imho.
Can we please get some more voices from the community voters here, if you are pro or contra a combined ZBX agent icon? This is a huge change coming towards all of us.
|
|
I don't really see the problem here, as you have to option to stay on 6.0(or older) and enjoy the current behaviour, or upgrade your environment to 6.2 to get the benefits of the new features. Thats IMO how it worked in the past, and should work. In the past the statement was always: Older agents are supported but new itemkeys, features and such are only available if you upgrade, especially in LTS releases.
IMO the proposal should work and it might be better to have separated icons, that could cause extra confusion as well (or to say at least cluttering in the frontend).
|
|
Agree with Brian here. Even with +3k hosts i dont see the issue of updating my agents. The icon is only an indication that the communication is working not that the items are working anyway. In passive even worse you can install a different server with an agent and the icon will turn green and your zabbix frontend will still show the old server.
the 1 icon idea made me scared when i was reading it but if you think about it not so bad at all imho it would save space (i like minimal) and you would still see if something is wrong you just need to to dat extra effort of moving your mouse over it.
no matter how its implemented i just hope that it gets implemented an indication that communication is working for active was long overdue.
|
|
That's a very short sighted argument. Sorry, no offense! Of course I can stay on 6.0 LTS, but for how long? Zabbix 7.0 LTS is due in 12 months from now. That's nothing.
To make that clear: My main issue is not, that I have to update the agent.
My main issue is the combination of an active and passive icon. If it would be separated, then all my now green passive icons wouldn't turn grey and I should plan a controlled agent update for all then out-of-date agents.
You are right with the point, that my arguments are based on maintaining old agents, and the problem would vanish, if I could just update all my agents and everything is green. But then still I really dislike the idea of an combined item. Sorry, that's just my feeling.
Besides the argument about to many icons shown at the same time: I would expect the active or passive icon only being shown, when there is an active or passive item type, just as it is now with SNMP for example.
Ps.: I'm still on 5.4.x because 6.0 was the same story all over. 50 nice new features, love it! But a few changes that just really hurt and at the moment I just don't know how I should continue with Zabbix: ZBXNEXT-7512 & ZBX-20613 & ZBX-20622 + all that is going on with the Latest data view.
|
|
Well, of course we can agree to disagree - and no offence here, but your incapability of updating all agents should not be the reason to change the policy as it used to be for years...
The combination of the icon is for me perfect - as we're still talking about the same protocol (zabbix agent), i don't really see a reason to separate it. Otherwise let me create tickets for separate icons for SNMP traps as well(and to prevent the discussion: yes, i have quite a few host that are sending every 30 seconds traps as heartbeat), cuz now the SNMP icon remains grey if there are only traps received on the interface.
IMO consistency is key here: one icon per protocol, just like it is now.
|
|
We are very close to releasing this functionality in one of Zabbix 6.2 alpha releases. It is about to be ready!
|
|
Implemented in:
Updated documentation (PR#182):
|
|
Hi DevTeam,
I have tested the new Zabbix 6.2Beta2 with an Agent2 and i saw this error repeatition:
I think is something related to this feature.
Thanks so much
|
|
Hello dimitri.bellini!
Thanks for noticing. The issue is being worked on.
|
|
@Dmitrijs,
thanks so much!
|
|
dimitri.bellini, the issue was fixed, once again, thanks for noticing it.
|
|
@Dmitrijs nothing, I'm here to help
|
|
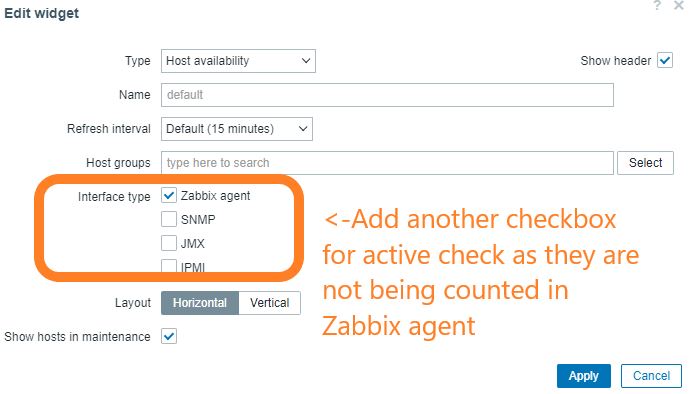
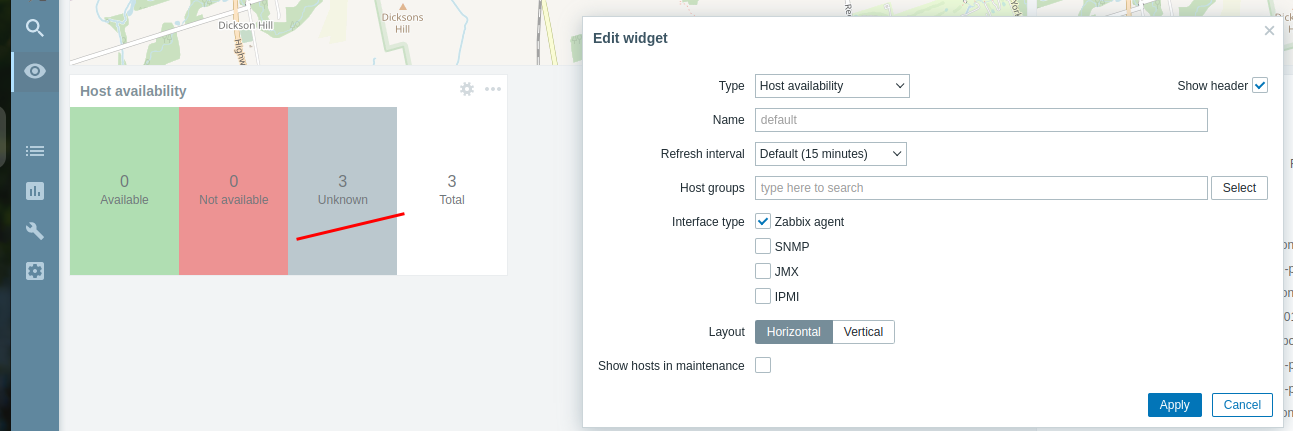
I don't know if I should raise a new issue, so I ask here since it's derivated from this one. Host Availability widget doesn't count the new ZBX green icon for active checks. It only does for the usual Zabbix Agent (Passive), SNMP, JMX, IPMI. It would be great to have another "interface type" in the widget that let us choose active checks:
I imagine people would rather have it separated than in the same category as Zabbix agent.
|
|
I do agree that seperate is a must for the widget, but an option to 'club' both types into one would be great as well!
|
|
Released ZBXNEXT-5088 in:
|
|
Just upgraded to 6.2.0rc1 and still is the active agent status unknown. Already got the latest zabbix agent running.

|
|
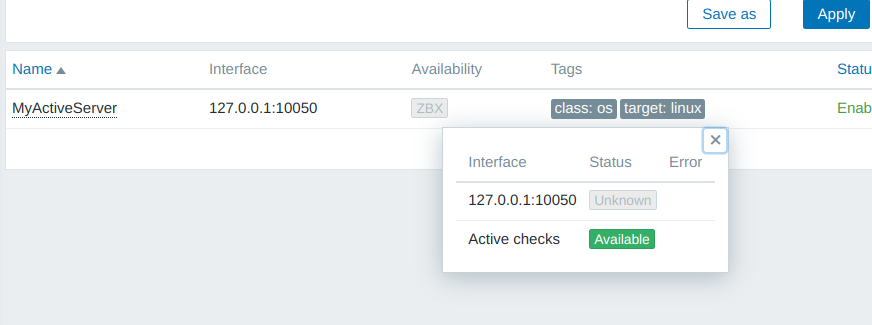
"Set Agent icon color to green on getting "active" data"
Auto-registration add hosts with interface making main icon gray, this makes host status icon useless with all this logic, since you need to click mouse more to find if Active check is working or not. This is inconvenient logic to make Active check depended on the availability of passive checks to show status. Also status item doesn't show availability with such logic.
|
|
mehmozh, zabbix[host,agent,available] reports availability of the agent interface. There is no interface for active agent checks so you will not see active availability with this item.
|
mehmet, zabbix[host,agent,available] reports availability of the agent interface. There is no interface for active agent checks so you will not see active availability with this item.
But Host without passive interface reports Active agent with Green icon, so zabbix[host,agent,available] can rely on this if implemented.
Auto registered host makes item Gray with working Active checks making Monitoring - Hosts, Configuration - Hosts less informative and forcing user to click-click-click mouse.
For example you have 20 hosts listed in Configuration - Hosts, all are auto-registered Active Agents, to view state - you need to click 20 times on icons, to check all of them, or go to Latest data, wait until server loads something useless (ZBX-20644), after filter data with broken Enter click on macOS and more mouse clicks (ZBX-21194) instead of showing 20 hosts with Green icons. It's a real pain to solve tasks in a such way. Especially if you work with this every day.
Sorry, but it looks like all the logic done is just to do more mouse clicks in case of an Active mode used.
|
|
Hi ZabbixDev,
I must deal with @Edgar, is not a "user friedly" way to manage the Host Availability icon.

At the first look, the host seems not working but as soon as I move the mouse over icon I can see the Green on Active Agent.
Please fix the logic. Thanks so much
|
|
https://support.zabbix.com/browse/ZBX-21080 
|
|
Instead of reopen please report further change requests as ZBX and comment here like brian.baekel. Thank you.
|
|
Hi,
Does this fix will be available to 6.0 LTS ?
Regards
|
|
Zeiko, no, this feature is 6.2+.
|
|
Hi, any news about this? I have installed Zbx 6.2.6 and in the widget I see the active agents availability as unknown. My agents do not have interfaces configured since their IP change all the time. Would be that the reason why I see their availability as unknown?
Thanks,
|
|
verde, there is a separate feature request about this, you can vote: ZBXNEXT-7736.
|
|
Hi DevTeam,
the new Agent Interface Availability Icon it's noce but on Zabbix v.6.4.x if we have an hosts monitored only by "Active Checks", look below screenshot

At the moment we have a "Gray Global Availability" because we do not have "Passive checks", for most of the users this is not clear at all.
The only possible workaround to see all "Green", it's to remove the "Agent interface" but we loose the IP of the hosts...
I would like to suggest to "Hide" the "Passive Availability Icon" if there is no "Passive Items configured".
In this way I think it's more clear for all the users.
Thanks so much
|
|
@Dimitri, 100% agree! See also ZBXNEXT-8487
|
|
Hi Nathan,
yes, correct! Different use case but same final result, confusion
Thanks!
|
|
I agree about the confusion. But let's remember a few things:
1. these icons only show the availability of the interface that has been declared on the host
2. in no way do these icons indicate the availability of the host itself. They are merely symptoms. This is why the panel title "Host availability" leads to a great deal of confusion and misinterpretation.
With regard to this last point, it is at the level of a model and the various authorizations on the security side that the availability of a piece of equipment can be designed. So it's often specific to each context. For example, for operating system equipment, correlating a "ping" with the availability of the Zabbix agent is starting to be a fairly strong symptom of unavailability, especially if this has happened 3 times in a row.
So it's important to distinguish between what is the responsibility of the editor - and I agree with Dominique about simplifying the view - and what is the responsibility of an integrator or customer who implements Zabbix in their context, taking into account security constraints.
So we need to take a global view and clearly define what availability means in each context.
If the "Host availability" widget could be renamed "Interfaces of host availaibilty", I think that would be better;
|
|
ZBXNEXT-8801 asks to set icon green when active checks are available and working and there is Agent interface with no passive checks.
|
|
It is a shame not been able to match the dashboards for ICMP/IP checks with the actual status of the device. Showing the status as "unknown" for devices just cuz the agent is now running really sucks for external availability checks.
The ones working with/as 'Dead Man's Snitch' know the pain.
|
Generated at Fri May 22 19:41:13 EEST 2026 using Jira 10.3.18#10030018-sha1:5642e4ad348b6c2a83ebdba689d04763a2393cab.